


Abstract—Normal branching patterns of the bronchi in in humans is unclear. The data in the last year indicate that the algorithms for determining the branching pattern of the bronchi are not exactly same between human and mice in the embryonic stages observed. It is possible that different algorithms and branching patterns may arise in the later stages of development. Therefore, we intend to obtain a three-dimensional coordinate on all branching points and subject this to mathematical analysis. A total of 33 samples between Carnegie Stages (CS) 14 and 21, belonging to Kyoto University Congenital Anomaly Research Center were used to acquire imaging data using the phase-contrast X-ray CT. The bronchi were extracted from the image data using the software Amira, and all bifurcations in each sample were named and 3D coordiane was provided. Morphometry was calculated using software assisted algorithms based on orthogonal coordinate of voxels in each reference point. We mainly analyse byhighlighting the angles of each branching.
Introduction
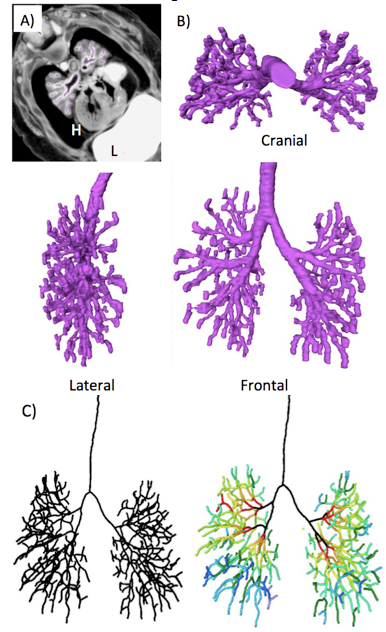
A) Representative PXCT image (transverse section) at CS21 embryo (ID. 21120). Thebronchi were manually segmented (purple). H; heart, L; liver
B) 3D reconstruction of bronchial tree (Purple). Cranial lateral, and frontal view were shown.
C) The center of the airline was shown linearly with the centerline module (left). Each branch was rainbow colorred according to the generation number of branches (right).
Classical morphological studies during the human embryonic period were previously analyzed with serial histological sections and visualized with 3D modeling and illustrations [1]. These methods were laborious and provided inaccurate 3D morphology. We have recently reported on human embryonic development with 3D reconstructions using digital imaging data such as MRI, phase contrast X-ray CT (PXCT) and digitized histological image. These data demonstrated dramatic growth during the embryonic period at each Carnegie stage (CS).
Many organs are composed of highly ramified tubular networks, each with a distinct architecture tailored to its physiological function. The bronchial tree of the human lung has more than one hundred thousand conducting and ten million respiratory airways arrayed in an intricate pattern crucial for oxygen flow. How such trees are generated during development, and how the developmental patterning information is encoded, have long fascinated biologists and mathematicians. However, models have been limited by a lack of information on the normal sequence and pattern of branching events.
Metzger et al. (2008)[1] demonstrated in mice that the tree is generated by three geometrically simple local modes of branching used in three different orders throughout the lung. We reconstructed the three-dimensional branching pattern and lineage of the human bronchial tree from an analysis of digital imaging data of PXCT during embryonic period. We compare the bronchial tree of human with that of mice, and test whether the modes of branching are analogous with the human bronchial tree. The data indicate that the algorithms for determining the branching pattern of the bronchi are not exactly same between human and mice in the embryonic stages observed. The possibility exists that different algorithms and branching patterns may arise in the later stages of development. We intend to obtain a 3D coordinate on all branching points and subject this to computational and mathematical analysis in the second year. The purpose of the present study was to analyze the 3D branching pattern of the bronchial tree during human embryonic development and determine the rule of the branching pattern. We mainly analyse by highlighting the angles of each branching.
Materials and Methods
Human Embryo Specimens
This study was approved by The Committee of Medical Ethics of Kyoto University Graduate School of Medicine, Kyoto, Japan (E986). Approximately 44,000 human embryos comprising the Kyoto Collection are stored at the Congenital Anomaly Research Center of Kyoto University [2]-[4]. In most cases, pregnancy was terminated during the first trimester for socioeconomic reasons under the Maternity Protection Law of Japan. Some of the specimens (approximately 20%) were undamaged, well-preserved embryos. Aborted embryos brought to the laboratory were measured and examined, then staged by using the criteria of O’Rahilly and Müller (1987)[5]. A total of 33 human embryos were selected between CS14 and CS22 that exhibited no obvious damage or anomalies.
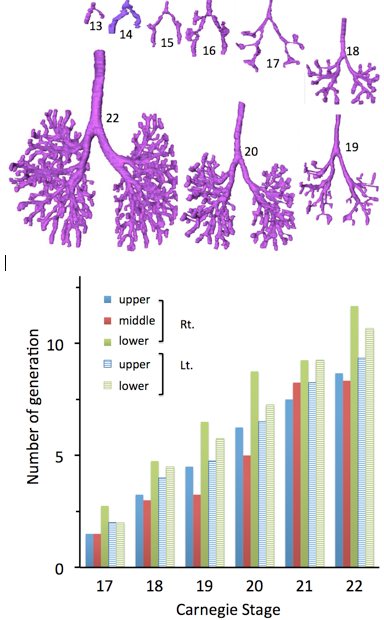
Fig. 4. Number of maximum generation of the branching according to the Carnegie stage
Image Acquisition and Data Analysis
The 3D PXCT image acquisition conditions are described elsewhere [6]. Briefly, specimens were visualized with a phase-contrast imaging system fitted with a crystal X-ray interferometer. The system was set up at the vertical wiggler beam line (PF BL14C) of the Photon Factory in Tsukuba, Japan. PCXT data from selected embryos were analyzed precisely as serial 2D and reconstructed 3D images (Fig.1). The structure of the bronchial tree was reconstructed in all samples using Amira software version 5.4.5 (Visage Imaging; Berlin, Germany). The center of the airway was linearly shown with the centerline module. Morphometry and Statistic analysis was calculated using software (MATLAB (ver.R2016a, MathWorks, USA) assisted algorithms based on orthogonal coordinate of voxels in each reference point.
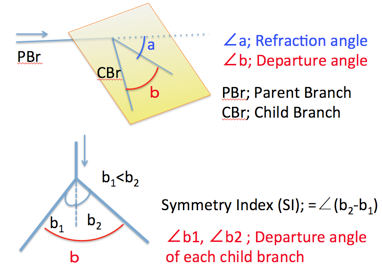
The proximal part of the interested bifurcation was called as parental branch (PBr), while peripheral parts of branches was called as child branches (CBrs). Refraction angle (∠a) was defined as the angle between PBr and the plane including the CBrs. Departure angle of bilateral CBr (∠b) was defined as the angle between two CBrs. Departure angle of the each CBr (∠b1 and ∠b2) was defined as the angles between the PBr and CBrs.Symmetry Index (SI) was defied as ∠b2 –∠ b1, which is the indicator of symmetricity. SI =0 means that a pair of CBrs separate symmetrically (as mirror image).
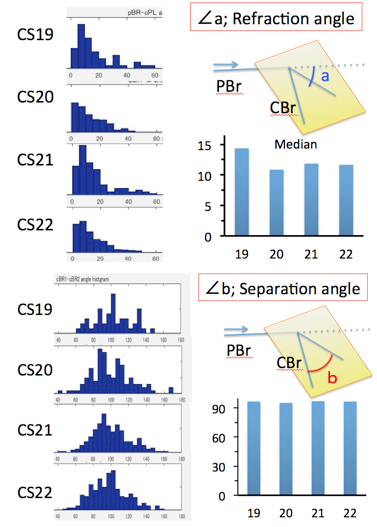
Fig. 6. Distribution of and separation angle
Results
Morphology of the bronchial tree
The Three-dimensional reconstruction revealed the precise morphology of the bronchial tree at each CS (Fig.3). The right and left main trunks were bifurcated from the trachea at CS 13. The right main bronchus soon shows a tendency to be longer and directed caudally, with the left bronchus being shorter and more transverse. Lobar buds are developing and are becoming marked by focal swellings at the sites of the future secondary bronchi at CS 15. The primary bronchi have definite, elongating branches at CS16. Additionally, at CS16, the right and left primary bronchi exhibit characteristic asymmetries. Each ends in a bulbous terminal growth center, and along the sides each demonstrates a characteristic type of elongating lateral branches. One can more easily recognize the groupings that will make up the three lobes on the right side and the two on the left side at CS17. Segmental buds represent the bronchopulmonary segments. The segmental bronchi are well defined and a few sub-segmental buds appear at CS18. The bronchi branch accurately and rapidly after CS19. Branching occurs more rapidly in the lower lobe than in the upper lobe. More than 12 branches were observed in the lower lobe at CS22.
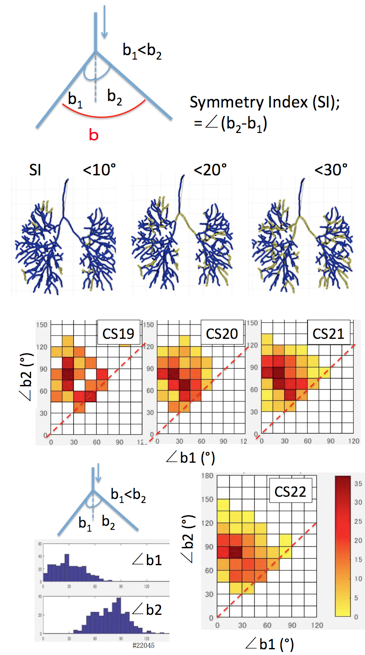
Fig. 8. 2D distribution color map showing the combination of separation angles (∠b1 and ∠b2) for all branchings in a representative samples.
Branching occurs more rapidly in the lower lobe than in the upper lobe (Fig.4). Number of maximaum generation of the branching was large in right lower lobule, left lower lobule, left upper lobe, right upper lobe, then right middle lobule in the order, when lobular branch is defined as first branch.
Mathematical analysis of the bronchial tree
Distribution of refraction angle (∠a) between CS19 and 22 was calculated (Fig.5). Refraction angle distributed between 0 and 60 degree in almost all branches analysed. Median refraction angle was almost constant during CS19 and CS22 (median; 10.9-14.4 degree).
Distribution of separation angle (∠b) between CS19 and 22 was calculated (Fig.6). Separation angle distributed between 40 and 140 degree in almost all branches analysed. Median separation angle was almost constant during CS19 and CS22 (median; 95.3-97.0 degree).
To examine whether two child branches separate symmetrically or not, Symmetry index (SI) was calculated. The branches separated symmetrically was relatively few, SI < ∠30 degree was about 10% of total branches observed (Fig.7) Relationship between two separation angles (∠b1 and ∠b2) in each branch were analysed (Fig.8). The 2D distribution color map indicate that two different groups may exist. One group distribute near the broken line (∠b1=∠b2), namely two child branches separate almost symmetrically. Another group was that one child branch (∠b1) separate as 15°<∠b1< 30°while another child branch (∠b2) separate as 75°<∠b2< 90°. Two groups relatively well separated in CS19, which become ambiguous in later stages.
Conclusion
We intend to continue computational, mathematical, and cluster analysis in the next year. For the analysis, we will collaborate with other research groups in A01 and others.
Acknowledgment
This work has been performed under the approval of the Photon Factory Program Advisory Committee (Proposal No.2013G514, 2012G138, 2014G018, and 2015G574).