


Abstract-The three-dimensional (3D) observations are required for analyzing complex morphogenetic processes that occur during human embryonic development. Serial histological sections were utilized not only for histological two-dimensional observation, but also for designing three-dimensional (3D) plaster or wax models, which enable the 3D changes to be visible, since the late nineteenth century. Analysis using the histological sections is the main approach that is developed in the recent studies. Additionally, imaging modalities, such as magnetic resonance imaging and phase contrast X-ray computed tomography, have been applied to embryology. High-resolution 3D datasets with an adequately large number of samples, covering a broad range of developmental periods with various methods of acquisition, are key features for the research. These datasets have the advantage of morphology, morphometry, and quantitative analysis using 3D coordinates. In particular, an adequate sample size is required for quantitative analysis using statistical methods and multidisciplinary computational anatomy (MCA) based analysis, which are expected to be useful analyzing methods for many unresolved tasks, such as quantitative movement (differential growth), branching morphogenesis, and information concerning physical and structural property. As a future perspective, analysis targets using digital imaging data may shift from embryonic period to early-fetal period (9-12 weeks after fertilization), which can apply to prenatal diagnosis using ultrasound. This data will timely contribute to improvements in prenatal diagnostics by detailing and comparing suitable markers for estimating developmental growth.
Three-dimensional analysis of human development using histological sections
Research for human embryology has been initiated since the late nineteenth century [1,2]. The morphological observations of human embryonic samples were the main approaches, including observation of the gross view, dissection, and histological sectioning. Classical embryology using histological techniques previously revealed a large number of morphological features according to the developmental stages and significantly contributed to the understanding of human development. Complex morphogenetic processes occur during embryonic development, which demanded the three-dimensional (3D) observations expanding to large areas. The 3D analyses using histological sections become the main approaches, which enable the 3D changes to be visible. Serial histological sections were not only utilized for histological two-dimensional observation, but also applied to design 3D plaster or wax models. The work of a team of scientists and technical specialists, such as illustrators and modelers, was established for development of human embryology. The historical models of Ziegler, Blechshmidt, and Heard are famous worldwide and are indispensable in research and teaching [3].
The 3D analyses using histological sections advanced with the advent of new technology. These include acquisition systems for digitalization of the samples, higher specification computers, and higher volume of storage. The digitized materials are primarily used for education and assistance of research, as they are attractive materials for students and researchers who could be apprehensive. They are also useful for database and references for the researches [4,5]
Using nearly 15,000 digitalized histological sections of the renowned Carnegie Collection of human embryonic specimens, de Bakker et al (2016) [6] created a 3D digital atlas and database featuring the first 2 months of human development. They identified and labeled up to 150 organs and structures per specimen and made 3D models to quantify growth, establish changes in the position of organs, and clarify current ambiguities. The 3D portable document formats of the reconstructions, and original and labeled images, are freely available (http://3datlasofhumanembryology.com).
Using whole-mount immunostaining, 3D imaging of solvent-cleared organ clearing and light-sheet imaging, Belle et al (2017) [7] generated a precise cellular and molecular cartography, a 3D cellular map of the human embryonic development during the first trimester of gestation. They provided high-resolution 3D images of the developing peripheral nervous, muscular, vascular, cardiopulmonary, and urogenital systems. Their work paved the way for a cellular and molecular reference atlas of human cells. All their 3D datasets are made available on a dedicated website (https://transparent-human-embryo.com/).
For an administrator of human embryo collections, the digitization of the histological glass slides is one solution for preserving the collections and for decreasing the maintenance cost. The Digital Embryology Consortium, an international partnership, was established in 2014 to digitize, preserve, and disseminate the major embryology histological collections for researchers (https://embryology.med.unsw.edu.au/embryology/index.php/Digital_Embryology_Consortium_-_Information) [8].
3D analysis of human development using imaging modalities in high resolution
Remarkable progress has been made in non-destructive imaging technologies, such as magnetic resonance imaging (MRI) and phase contrast X-ray computed tomography (CT), which have all been applied to embryology [9,10]. The imaging modalities are selected based on their destructive versus non-destructive features, the size of the samples, and the desired resolution.
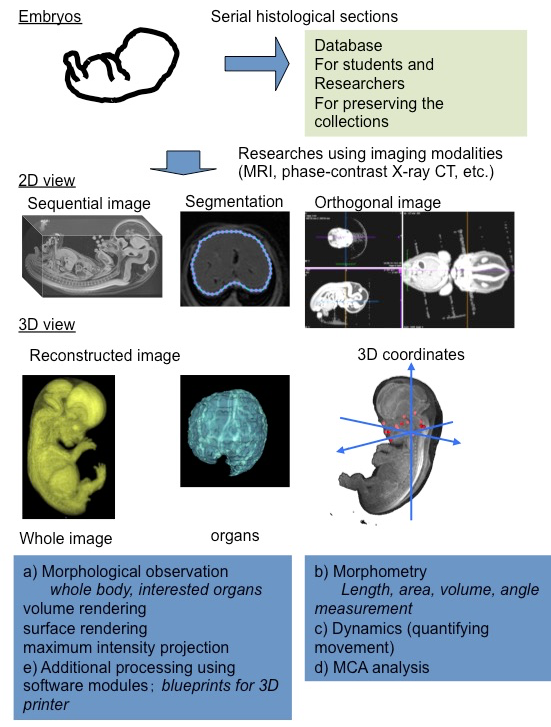
Using MRI and ptychographic X-ray CT, our group proceeded the 3D analysis of human embryonic development, including organogenesis as research [11] (Figure 1). High-resolution 3D datasets with an adequately large number of samples, covering a broad range of developmental periods with various methods of acquisition, are key features for this research. These data sets have the advantage of morphology, morphometry, and quantitative analysis using 3D coordinates. In particular, an adequate sample size is required for quantitative analysis using statistical methods and PCA.
Morphological observations
The digital data had the following gross merits, which increased the efficiency of observations and accelerated the speed of morphological observations: 1) The data enabled us to analyze classical morphology and morphometry efficiently. 2) The complete 3D external and internal views and their reconstructions are easily obtained. 3) The obtained images can be resliced and rotated freely on the screen, by which the 3D shapes of the objects and their spatial relationships with the adjacent organs and tissues are easily recognizable. 4) The images from different embryos are simultaneously comparable on the screen. 5) Volume-rendering data can be utilized for advanced analysis.
Morphometry
Classical embryology using histological techniques provided little morphometric data [12,13]. For the measurement of spatial distances and angles between anatomical landmarks of interest, 3D reconstruction from serial histological sections was required. The procedure for such measurements was quite laborious with a number of possible issues that could arise, such as non-rigid deformation, tissue discontinuity, and accumulation of scale [A1] [14]. The digital data from MRI and CT have merit for morphometry. Precise morphometric data, length, angle, area, and volume of target regions and organs can be measured on the screen using digitalized data from MRI and CT images. Such morphometric data are useful for demonstrating the development features at each stage and for screening abnormally developed samples.
Quantitative analysis using 3D coordinates
A 3D coordinate can be given for each landmark by examining the position of the voxel on 3D digital data. Application of 3D coordinates of anatomical landmarks, especially MCA based analysis, are expected to be useful analyzing methods for many tasks, which remain to be dissolved as follows:
Quantitative movements (differential growth)
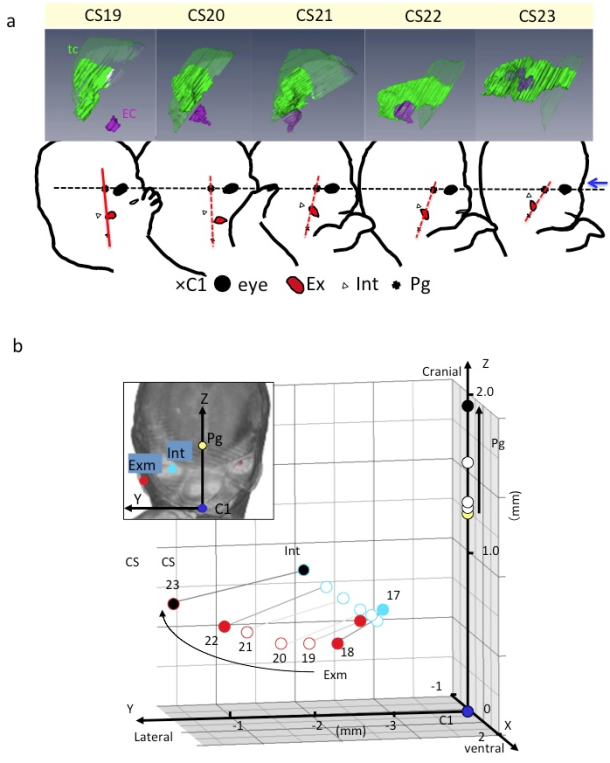
A) Lateral view of embryos between Carnegie stage (CS) 19 and CS 23 showing the tympanic cavity and ear canal (upper) and craniofacial morphogenesis (lower). The ear canal (ec), external ear (Ex), eye (Ey), first cervical vertebra (C1), internal ear (int), pituitary gland (Pg), and tympanic cavity (tc). The dashed line indicates the reference axis connecting the middle point of the bilateral Ey and Pg (X-axis). The red line indicates the reference line connecting Pg and C1. Blue arrow indicates the frontal side of the face. Note that the Exm and Int are observed at similar position on the red segment. There is a gross change of angle between the black and red lines used. The change of angle may result from the formation of the mandibular apparatus and the structures at the base of the skull.
B) Three-dimensional graph showing the relationship between the right external ear (Exm) and internal ear (Int) during development. Axes and anatomical landmarks are shown on frontal view of volume-rendering images.
Abbreviations: Carnegie stage (CS), external ear (Exm), first cervical vertebra (C1). internal ear (int), pituitary gland (Pg)
Both the external and internal structures of embryos rapidly change in size and shape during the period of organogenesis. Many dynamic events are traditionally described as migration in which the position of structures changes from one region of the embryo to another. Gasser (2006) [15] recently demonstrated most of the positional changes of the developing structures, such as the sclerotome formation from the somite, the spinal ganglion formation from the neural crest, and the endocrine glands formation from the pharyngeal endoderm, which can be explained by differential growth.
For understanding the positional change of landmarks of interest and their relationships during development, the digitized data was advantageous for comparing structures of interest between different stages with identical magnification, superimposed on the same screen. The 3D positional change of interesting landmarks and their relationships during development were demonstrated [11,16-18], which indicated that many dynamic events can be explained by differential growth using 3D coordinates (Figure 2).
Shared mechanism for human organogenesis (Branching morphogenesis)
Organs, such as bronchi of the lungs, urinary collecting trees of the kidneys, the milk ducts of the mammary gland, develop from branched tubes during embryonic and fetal development. Because of many similarities between these branched tube structures, the shared mechanism was assumed. Recently, Hannezo et al (2017) [19] proposed a unifying theory to solve this issue. Namely, the certain tips stop growing in a random manner. For example, the branched mammary gland structures stop growing when the tips of the structure impinge on neighboring branches. In the kidney, this cessation has been proposed to occur when nephrons form near the end of the collecting ducts. The unifying theory mainly comes from experimental in vitro model or in vivo animal models. Analysis using human samples with 3D coordinates is awaited [20] (Figure 3AB).
Information concerning physical and structural property
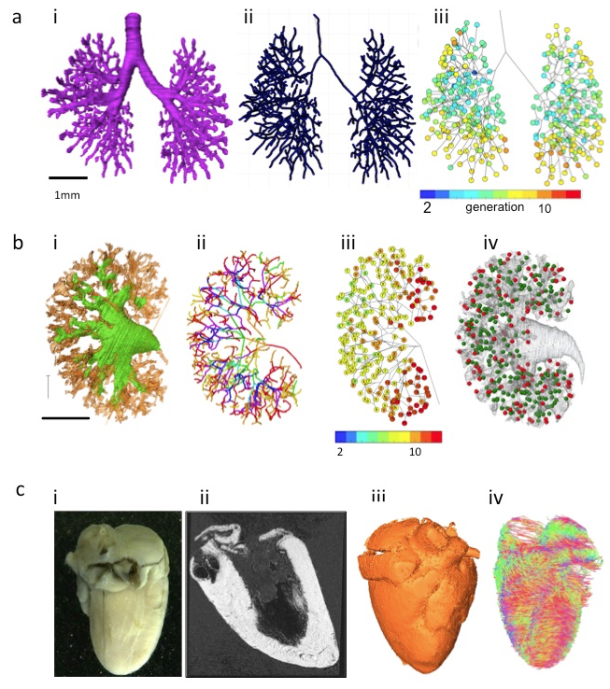
A) Branching morphogenesis of the human bronchi during embryonic period
(a) The bronchial tree was extracted from ptychographic X-ray computed tomography image.
(b) Centerline of the bronchial tree was processed.
(c) Generation number of each branch segments was indicated by colors.
B) Branching morphogenesis of the human urinary collecting system (UCS) at Carnegie stage 23
(a) The UCS was extracted.
(b) Centerline of the bronchial tree was processed. The tree was illustrated by rainbow colors from the proximal to peripheral branches.
(c) Generation number of each branch segments was indicated by number and colors.
(d) Position of nascent nephrons connected (green) and not connected (red) to UCS are shown.
C) The fetal heart ex vivo (crown-rump length=94 mm)
(a) The frontal gross view.
(b) Magnetic resonance imaging (MRI)-T1 image.
(c) The 3D volume-rendering image.
(d) Diffusion tensor images MRI (DTI-MRI).
Imaging modalities data contain information not only regarding 3D morphology, but also regarding physical property. Diffusion tensor images MRI has also been applied to fetal brain [21] and cardiac muscles in mice [22,23]. The method is applicable to various organs and tissues that are anisotropic in nature (Figure 3C). Mesenchymal tissues consisting of fibers and membranous structures, such as the muscles, tendons, arteries, and bones, may be candidates for application of this method. These tissues have not been analyzed vigorously because of technical reason and their large target size.
Phase-contrast X-ray computed tomography with Zeff imaging methods can be used to recognize and differentiate heavy metals, such as iron, aluminum, nickel, and copper [24]. The 3D dynamics of such elements during human embryonic development are not currently known. Hematogenesis of the embryos may be also detectable using iron as a trace marker. This information with 3D distribution may provide new insight of human development.
Perspective
Shift from embryonic period to early-fetal period (9-12 weeks after fertilization)
The number of morphological studies on the early-fetal period (9-12 weeks after fertilization) is less as compared to that on the first 8 weeks after fertilization (at the end of Carnegie stage [CS] 23) [2] due to the several reasons. First, many researchers have been attracted to the dynamic morphogenesis in rather earlier developmental stages. Establishment of CS may contribute in encouraging studies for the early-fetal period. Second, it is difficult to apply histological analysis for the entire body of the fetus with a size larger than that at CS 23. Therefore, studies conducted on fetal period are mainly confined to localized histological analysis. The 3D datasets of larger samples corresponding to early-fetal period can be acquired with MRI in high resolution, which are worth analyzing as they can reveal the 3D development of the entire body and organs. Such morphometric data are also valuable for connecting and comparing the sonography data.
Application to prenatal diagnosis
The 3D information obtained in classical embryology since the late nineteenth century has been used as the basis of prenatal diagnosis using ultrasound (US). The use of US for prenatal diagnostics has rapidly increased in the past 30 years [25]. Moreover, 3D sonography performed with high-frequency transvaginal transducers has expanded as 3D sonoembryology, which provides a basis for assessing normal human development and can also be useful in detecting developmental anomalies [25,26].
Prenatal diagnosis using US enables a shift in diagnostics from the second trimester to the first trimester of gestation. At present, an embryo at 9 weeks after fertilization or younger can be assessed via morphological and morphometrical analyses, which corresponds to a CS of 15-16. While abnormal embryos younger than 12 weeks after fertilization are observed by chance for clinical indications, systematic screening using sonographic parameters results in the detection of abnormalities during the late first trimester (12-13 weeks after fertilization). Analysis using the digital data with MCA based method, during early-fetal period could timely contribute to improvements in prenatal diagnostics by detailing and comparing suitable markers for estimating growth and development [27].
References
- Morgan LM. A social biography of Carnegie embryo no. 836. Anat Rec B New Anat. 2004; 276:3-7. doi: 10.1002/ar.b.20002.
- O’Rahilly R, Muller F. Developmental stages in human embryos: including a revision of streeter’s horizons and a survey of the Carnegie collection. Washington: Carnegie Institution of Washington; 1987.
- Smith BR. Visualizing human embryos. Sci Am. 1999; 280: 76-81. doi: 10.1038/scientificamerican0399-76.
- Momose A, Takeda T, Itai Y, Hirano K. Phase-contrast X-ray computed tomography for observing biological soft tissues. Nat med. 1996; 2: 473-5. doi: 10.1038/nm0496-473.
- Takakuwa T. 3D analysis of human embryos and fetuses using digitized datasets from the Kyoto Collection, Anat Rec. 2018; 301:960-9. doi: 10.1002/ar.23784
- O’Rahilly R, Müller F. Developmental stages in human embryos: revised and new measurements. Cells Tissues Organs. 2010; 292:73-84. doi: 10.1159/000289817.
- Levitan ML, Desmond ME. Expansion of the human embryonic brain during rapid growth: area analysis. Anat Rec. 2009; 292:472-80. doi: 10.1002/ar.20882.
- Kajihara T, Funatomi T, Makishima H, Aoto T, Kubo H, Yamada S, et al. Non-rigid registration of serial section images by blending transforms for 3D reconstruction. Pattern Recognition. 2019; 96: 106956. doi.org/10.1016/j.patcog.2019.07.001
- Gasser RT. Evidence that some events of mammalian embryogenesis can result from differential growth, making migration unnecessary. Anat Rec B New Anat. 2006; 289:53-63. doi: 10.1002/ar.b.20092.
- Kagurasho M, Yamada S, Uwabe C, Kose K, Takakuwa T. Movement of the external ear in human embryo. Head Face Med. 2012; 8:2. doi: 10.1186/1746-160X-8-2.
- Katsube, M, Yamada, S, Yamaguchi Y, Takakuwa T, Yamamoto A, Imai H, et al. Critical growth processes for the midfacial morphogenesis in the early prenatal period. Cleft Palate-Craniofacial J. 2019; 56: 1026–37. https://doi.org/10.1177/1055665619827189
- Ozeki-Satoh M, Ishikawa A, Yamada S, Uwabe C, Takakuwa T. Morphogenesis of the middle ear ossicles and spatial relationships with the external and inner ears during the embryonic period. Anat Rec. 2016; 299: 1325-37. doi: 10.1002/ar.23457.
- Hannezo E, Scheele CLGJ, Moad M, Drogo N, Heer R, Sampogna RV, et al. A unifying theory of branching morphogenesis. Cell. 2017;171: 242–55. doi: 10.1016/j.cell.2017.08.026.
- Ishiyama H, Ishikawa A, Kitazawa H, Fujii S, Matsubayashi J, Yamada S, et al. Branching morphogenesis of the urinary collecting system in the human embryonic metanephros, PLoS ONE 2018; 13: e0203623. doi: 10.1371/journal.pone.0203623
- Huang H, Xue R, Zhang J, Ren T, Richards LJ, Yarowsky P, et al. Anatomical characterization of human fetal brain development with diffusion tensor magnetic resonance imaging. J Neurosci 2009; 29:4263-73. doi: 10.1523/JNEUROSCI.2769-08.2009.
- Mekkaoui C, Porayette P, Jackowski MP, Kostis WJ, Dai G, Sanders S, et al. Diffusion MRI tractography of the developing human fetal heart. PLoS One. 2013 ;8:e72795. doi: 10.1371/journal.pone.0072795.
- Angeli S, Befera N, Peyrat JM, Calabrese E, Johnson GA, Constantinides CA. High-resolution cardiovascular magnetic resonance diffusion tensor map from ex-vivo C57BL/6 murine hearts. J Cardiovasc Magn Reson. 2014; 16:77. DOI: 10.1186/s12968-014-0077-x
- Yoneyama A, Hyodo K, Takeda T. Feasibility test of Zeff imaging using x-ray interferometry. Appl Phys Lett. 2013; 103:204108. https://doi.org/10.1063/1.4831773.
- Blaas HG. Detection of structural abnormalities in the first trimester using ultrasound. Best Pract Res Clin Obstet Gynaecol. 2014; 28:341–53. doi: 10.1016/j.bpobgyn.2013.11.004.
- Pooh RK, Shiota K, Kurjak A. Imaging of the human embryo with magnetic resonance imaging microscopy and high-resolution transvaginal 3-dimensional sonography: human embryology in the 21st century. Am J Obste Gynecol. 2011; 204: 77:e1–e16. doi: 10.1016/j.ajog.2010.07.028.
- Kobayashi A, Ishizu K, Yamada S, Uwabe C, Kose K, Takakuwa T. Morphometric human embryonic brain features according to developmental stage. Prenat Diagn. 2016; 36:338-45. doi: 10.1002/pd.4786.