


寺島さんの修士論文がJ Anatomyに受諾されました。おめでとうございます。
- 胎児期のみに出現し、大脳皮質の形成、自発活動の開始に関わる可能性のあるプレサブプレート(pSP)の形成について、連続組織画像を用いて立体的に視覚化し、定量化した。
- PSPはCS21で大脳壁の中外側領域に存在し、この領域を中心とした拡大が観察され、胎児期の初期(CRL 39 mm)に大脳半球全体で観察した。
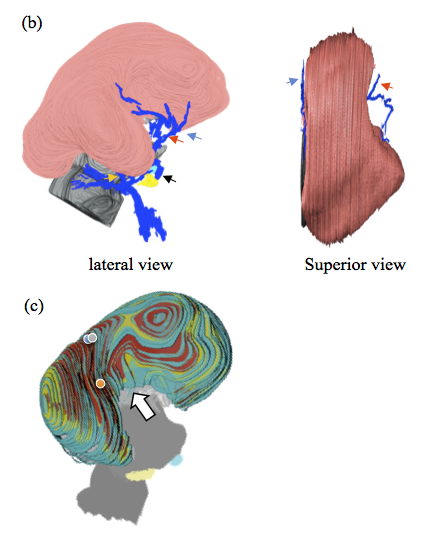
- pSP-IZ の厚さは 3D で表示され、中外側領域で大きかった。CRL 64 mm)に、厚い領域は、島の原基の周りの外側、上部、および後部領域に拡大しました。
- 層構造は、発達初期に厚くなるのではなく、薄く成長して広がった。
Terashima, M., Ishikawa A., Männer J., Yamada S.&Takakuwa T. (2021) Early development of the cortical layers in the human brain. Journal of Anatomy, 239, 1039–1049. https://doi.org/10.1111/joa.13488
Abstract
The cortical plate (CP) first appears at seven postconceptional weeks (pcw), when it splits the preexisting preplate into two layers, the marginal zone and the presubplate (pSP). Although three-dimensional (3D) analysis using fetal magnetic resonance imaging and two-dimensional tissue observations have been reported, there have been no studies analyzing the early development of the layer structure corresponding to the pSP stage in 3D. Here, we reconstructed 3-D models of the brain with a focus on the cortical layers in pSP stage. To achieve this, we digitized serial tissue sections of embryos between CS20 and CS23 from the Kyoto Collection (n = 7, approximately 7–8.5 pcw), and specimens at early fetal phase from the Blechschmidt Collection (n = 2, approximately 9.5–12 pcw, crown rump length [CRL] 39 and 64 mm). We observed tissue sections and 3D images and performed quantitative analysis of the thickness, surface area, and volume. Because the boundary between pSP and the intermediate zone (IZ) could not be distinguished in hematoxylin and eosin-stained sections, the two layers were analyzed together as a single layer in this study. The histology of the layers was observed from CS21 and became distinct at CS22. Subsequently, we observed the 3-D models; pSP-IZ was present in a midlateral region of the cerebral wall at CS21, and an expansion centered around this region was observed after CS22. We observed it over the entire cerebral hemisphere at early fetal phase (CRL 39 mm). The thickness of pSP-IZ was visible in 3D and was greater in the midlateral region. At the end of the pSP stage (CRL 64 mm), the thick region expanded to lateral, superior, and posterior regions around the primordium of the insula. While, the region near the basal ganglia was not included in the thickest 10% of the pSP-IZ area. Middle cerebral artery was found in the midlateral region of the cerebral wall, near the area where pSP-IZ was observed. Feature of layer structure growth was revealed by quantitative assessment as thickness, surface area, and volume. The maximum thickness value of pSP-IZ and CP increased significantly according to CRL, whereas the median value increased slightly. The layer structure appeared to grow and spread thin, rather than thickening during early development, which is characteristic during pSP stages. The surface area of the cerebral total tissue, CP, and pSP-IZ increased in proportion to the square of CRL. The surface area of CP and pSP-IZ approached that of the total tissue at the end of the pSP stage. Volume of each layer increased in proportion to the cube of CRL. pSP-IZ and CP constituted over 50% of the total tissue in volume at the end of the pSP stages. We could visualize the growth of pSP-IZ in 3D and quantify it during pSP stage. Our approach allowed us to observe the process of rapid expansion of pSP-IZ from the midlateral regions of the cerebral wall, which subsequently becomes the insula.