


Abstract—The morphology of the human embryo, especially the skeletal structure, is potentially important during development. The aim of this study was to analyze the formation of the rib cage to detect prominent features of human development. Rib cage formation was analyzed using high-resolution digitalized imaging data (n=34) between CS17 and CS23. The rib cage first appeared as cartilage formation at CS17 and was located at the dorsal side of the chest-abdominal region. Each pair of ribs covered the region during development, and differentiation of the upper and lower rib cage was detectable at CS20. The upper part of the rib cage was closed by the tip of each pair of ribs attached to the sternum between CS21 and CS23, while the lower part was widely open. PC1 and PC2 accounted for 76.3% and 16.4% (sum, 92.7%) of the total variance, that mean that the change of shape is mainly documented by two component. Change in PC1 shows the circular form surrounding the body trunk. Decrease of PC1 showed the closing of the tip of ribs, while increase of the PC1 showed the aperture of the tip of the ribs. Change in PC2 showed the dorsal convex of the ribs. Increase of PC2 showed the dorsal convex of the ribs while decrease of the PC2 showed the lateral projection at the middle part of the ribs. Distribution of PC1 and PC2 value by each rib showed high correlation with fitted to quartic equation (y = 0.072×4 + 0.1535×3 + 0.1785×2 – 0.2976x – 0.7001; R² = 0.820). PC1 and PC2 value of each rib pair moved its position along to the fitting curve according to the development from CS 18 to CS 23.The change in PC1 and PC2 could be expressed by one parameter using fitting curve as linear scale for Shape, indicating that all 12 paired ribs differentiate its shape according to a common sequential changes during human embryonic period.
Introduction
During human development, both external and internal morphological features change dramatically. External features, including those on the main body, provide a good basis for determining the staging of each developing embryo. For example, flexion and extension of the main body combined with the posture of the upper and lower extremities have been integrated into the Carnegie stage (CS), which is universally accepted for determining the staging of human embryos [1]. Though such qualitative external changes are well described in the literature, three-dimensional (3-D) quantitative changes in the main body have not been well analyzed. The application of 3-D sonography with high-frequency transvaginal transducers has expanded and now fosters 3D sonoembryology, which provides a basis for assessing normal human development and can also be useful in detecting developmental anomalies [2,3]. Thus, such technology could contribute to more accurate prenatal diagnoses, as well as enable a shift in the diagnostic time window (from the second to the first trimester). Under these circumstances, the quantitative data of standard morphology for each CS is required for evaluations of the rib cage in clinically obtained data, to allow for better prenatal morphological diagnosis.
The rib cage mainly consists of 12 pairs of ribs and vertebrae as well as the hypaxial muscles on the chest and upper abdominal parts of the main body. In the early embryonic period until CS16, all visceral organs, such as the heart, lung, liver, and digestive tract are covered with soft tissue. However, these organs are not protected by the rib cage because no cartilage or muscle formation is observed until CS16 [1,4]. Such organs are covered by the rib cage until the end of the embryonic period. During this time, the cartilage will form, the ribs will elongate, and the hypaxial muscles will differentiate. The rib cage can be divided anatomically and functionally into the upper and lower thoracic regions. The 1st to 7th pairs of ribs, which are identified as true ribs, are attached to the sternum in the anterior parts, while the 8th to 12th pairs of ribs are false, or floating, ribs. The upper region is related to the pulmonary part of the respiratory system and the upper limbs while the lower thorax is anatomically related to the diaphragmatic part of the respiratory system, and also closer to the abdominal cavity and locomotor apparatus [5-7].
Development and differentiation procedures are not fully documented; these procedures at each CS are less documented. We have recently reported on human embryonic development with 3-D reconstructions using digital imaging data techniques such as MRI, phase contrast X-ray CT (PXCT), and digitized histological images [8]. The 3-D digital data demonstrated dramatic growth during the embryonic period at each CS. Such 3-D data are advantageous in that they allow precise reconstruction of each organ and acquire the anatomical landmarks with 3-D coordinates. This enables a potential understanding of the 3-D development and differential growth of each anatomical landmark by the movement of the 3-D coordinate. In the present study, the rib cage, including the ribs and vertebrae, were analyzed during the embryonic period using the 84 3-D coordinates/samples assigned. In addition to the basic analysis of morphology and morphometry, principle component analysis (PCA) was also conducted for all rib pairs.
Materials and Methods
Human Embryo Specimens
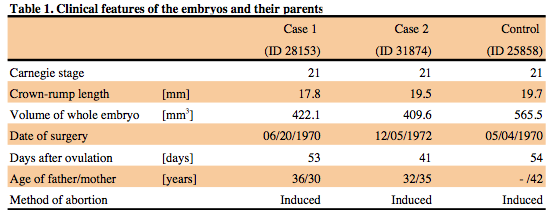
This study was approved by The Committee of Medical Ethics of Kyoto University Graduate School of Medicine, Kyoto, Japan (E986, R0316, R0989). Approximately 44,000 human embryos comprising the Kyoto Collection are stored at the Congenital Anomaly Research Center of Kyoto University [9-11]. In most cases, pregnancy was terminated during the first trimester for socioeconomic reasons under the Maternity Protection Law of Japan. Some of the specimens (approximately 20%) were undamaged, well-preserved embryos. Aborted embryos brought to the laboratory were measured, examined, and staged using criteria established by O’Rahilly and Müller (1987). A total of 34 human embryos were selected between CS17 and CS23 and exhibited no obvious damage or anomalies.
Image Acquisition and Data Analysis
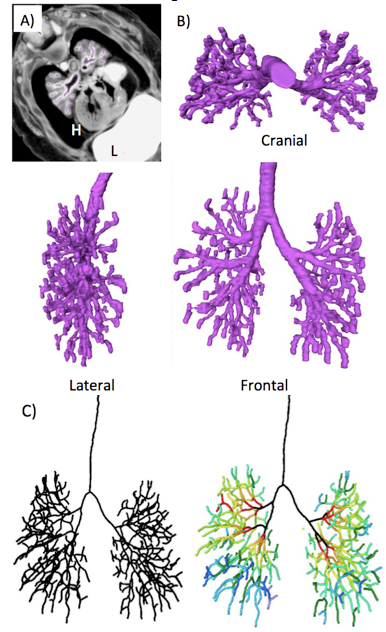
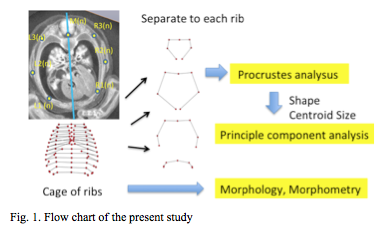
PXCT was used for 28 samples. The 3-D PXCT image acquisition conditions are fully described by Yoneyama et al. [12, 13] Briefly, specimens were visualized with a phase-contrast imaging system fitted with a crystal X-ray interferometer. The system was set up at the vertical wiggler beam line (PF BL14C) of the Photon Factory in Tsukuba, Japan. MRI was used for six samples at CS22 and CS23. MR images were acquired using a 7-Tesla MR system (BioSpec 70/20 USR; Bruker Biospin MRI GmbH, Ettlingen, Germany) with a 35 mm-diameter 1H quadrature transmit-receive volume coil (T9988; Bruker Biospin MRI GmbH). PCXT and MRI data from selected embryos were analyzed precisely as serial 2-D and reconstructed 3-D images (Figure 1). The structures of the rib cage were reconstructed in all samples using Amira software (version 5.5; Visage Imaging, Berlin, Germany). The 3-D coordinates were initially assigned by examining the voxel position on 3-D images using Amira software. Seven rib cage landmarks, from the first to twelfth vertebra, and the ribs (for a total of 84 landmarks) were located for each sample, as shown in Figure 1.
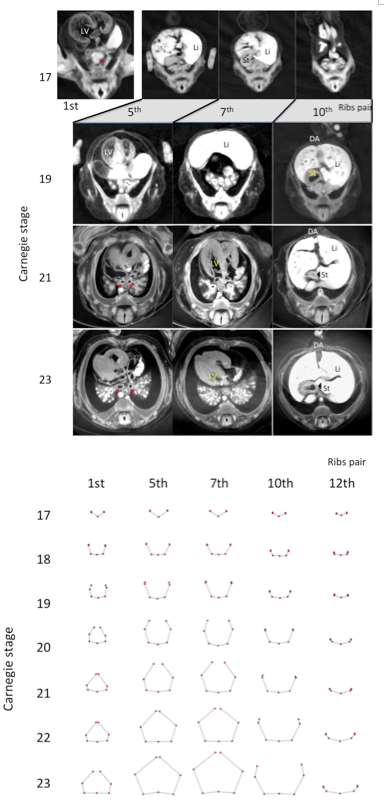
Figure 3. Representative drawing of the five transverse sections (1st, 5th, 7th, 10th, and 12th pairs of ribs) between CS17 and CS23. Each pair of ribs was represented by connection of seven landmarks except CS17, which was represented by five landmarks.
Orthogonal axis and coordinate transformation
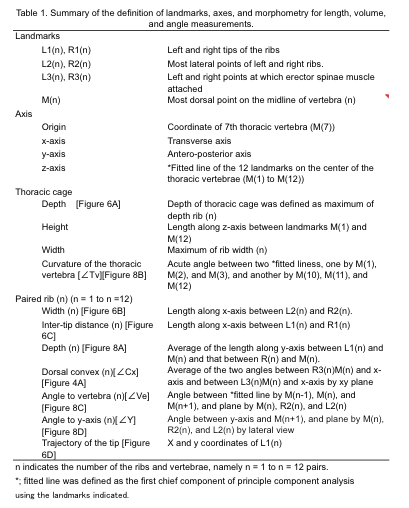
Representative drawings at each stage were calculated using software-assisted (MATLAB R2017b, MathWorks, USA) algorithms that were based on orthogonal coordinates of voxels in each reference point. The landmarks from all samples were spatially standardized by parallel and rotational transition without any magnifications. The coordinate of the 7th thoracic vertebra (M(7)) was defined as the origin. The z-axis was determined by the fitted line of the 12 landmarks on the center of the thoracic vertebrae (M(1) to M(12)). The transverse axis was defined as the X-axis, while the antero-posterior axis was defined as the Y-axis. The definition of the 84 landmarks, 3 axes, and morphometry for length, volume, and angle measurement are summarized in Table 1.
Procrustes analysis and Principle components analysis
Drawing of 12 pairs of ribs and thoracic cage from each sample, was analysed individually. Namely a total of 384 sample data was subjected to generalized Procrustes analysis (GPA) and principle component analysis (PCA), which was calculated using software-MATLAB (R2017b, MathWorks, USA) assisted algorithms based on orthogonal coordinate of voxels in each reference point.
Standardized morphological ribs were calculated from all 348 pared of ribs. Procrustes analysis was applied to ensure that the landmark coordinates were translated, scaled, and rotated to the best superimposition. Value of each paired of rib was divided into the component of the size and the shape. The size of each specimen was represented as centroid size, which was calculated as the square root of the sum of squared distances from the centroid to each landmark. The resulting landmark coordinates were called Procrustes shape coordinates. To summarize the variations in the paired ribs, principal component analysis (PCA) was performed for the Procrustes shape coordinates.
Results
A. Transverse section with PXCT
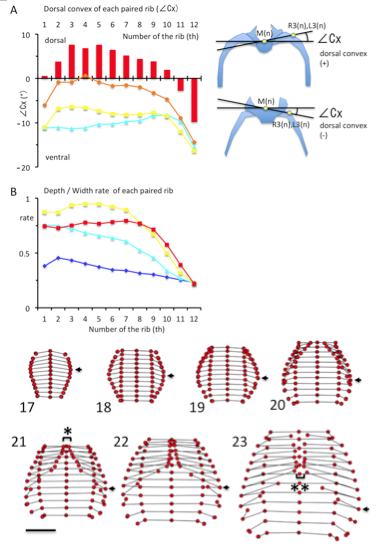
(A) The dorsal convex of each rib pair from the 1st pair to the 12th pair, estimated by∠Cx (in degrees). ∠Cx > 0 mean that he ribs is outwardly convexed and dorsal to the vertebral column. Illustration indicating the ∠Cx provided in the right. Light blue; CS19, Yellow; CS21, Orange; CS22, Red; CS23 (B) Ratio of depth to width of each paired rib from the 1st pair to the 12th. Blue; CS17, Light blue; CS19, Yellow; CS21, Red; CS23
Figure 5. Drawings of the rib cage between CS17 and CS23. The rib cage was represented by the connection of 84 landmarks. The scale indicates 2.0 mm. Arrows indicate the largest width of rib cage. *,**: The tips of each pair of ribs from the 1st pair to the 7th became close to each other at the median plane (xy-plane) as if closing a zipper from the cranial end to the caudal end, between CS21 and CS23.
Transverse sections of the chest and abdomen were observed at the level of each pair of ribs; each rib pair and vertebra was observed at the dorsal side during CS17. The cage elongated and surrounded the main chest and upper abdominal organs. All 12 thoracic vertebrae and paired ribs were made of cartilage, and no ossification was observed until CS23. At first, the main organs exhibited a change in location and these observations are recorded in Figure 2. These organs descend caudally during development. The left ventricle of the heart was observed in a cross section around the level of the 1st pair of ribs at CS 17, around the level of the 5th pair of ribs at CS19, and around the level of the 7th pair of ribs between CS21 and CS23. The main bronchi were observed by cross section around the level of the 1st pair of ribs at CS17, around the level of the 3rd pair of ribs at CS19, and around the level of the 5th pair of ribs between CS21 and CS23. The liver was observed at cross section around the level of the 5th- 7th pairs of ribs at CS 17, around the level of the 7th -10th pairs of ribs at CS19, and around the level of the 10th pair of ribs to the abdominal part between CS21 and CS23. The stomach was observed at cross section around the level of the 7th pair of ribs at CS17, the level of the 10th pair of ribs at CS19, and the level of the 11th pair of ribs between CS21 and CS23.
B. Formation of each paired ribs (cranial view)
We illustrated each pair of ribs and vertebrae with the connection of five landmarks at CS17 and seven landmarks between CS18 and CS23 to observe rib formation during development. L3(n) and R3(n) was not indicated because the erector spinae muscle was still not detectable at CS17. The morphology of all transverse sections is similar at CS17 (Figure 3). Pairs of almost linear ribs and thoracic vertebrae surrounded the dorsal side of the rib cage at CS17. The sections became trapezoidal in shape; the sections at the 11th and 12th rib, however, were not. The differences between the morphology of the ribs in the upper and lower regions become prominent at around CS20. The ribs were curved and the tip elongated medially, forming an arch after CS20 in the upper regions. The tips of each paired rib became closed to each other, as they were joined with the sternum. At the same time, the tips of the ribs elongated almost antero-laterally in the lower region.
The ribs became outwardly convex and dorsal to the vertebral column between the first and tenth ribs at CS23 (Figure 4A). The local maximum was observed between the third and fifth ribs (7.56 ± 3.38 degree at the 3rd rib, 6.81 ± 1.74 degree at the 4th rib, and 7.55 ± 2.10 degree at the 5th rib).
The transverse sections of the upper rib cage became pentagonal as the medial part of the chest expanded. The depth/width ratio increased to almost 1.0 in the upper region of the rib cage at CS20 and CS21 (range between 1-7th ribs was 0.87 – 0.99 at CS20 and 0.89 – 0.95 at CS21) (Figure 4B). This range slightly decreased at CS23 (range between 1-7th ribs was 0.73 – 0.80). Cartilaginous structures, including the ribs, vertebrae, and future sternum, surrounded the upper part of rib cage. The depth/width ratio was lower in the lower regions of the rib cage.
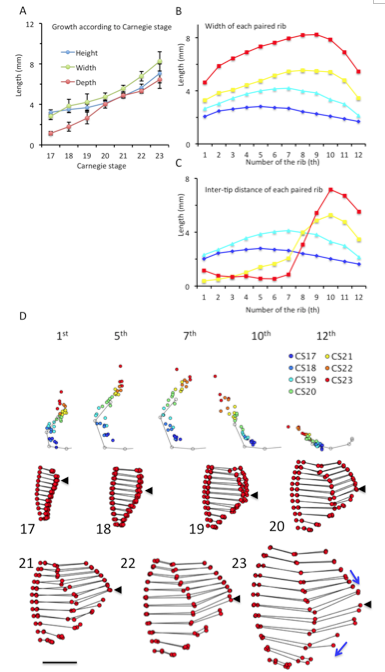
(A) Height, width, and depth of the rib cage, based on CS. Each parameter was measured as described in Materials and Methods. (B) Width of each paired rib from first to 12th. (C) Inter-tip distance of each pair of ribs between CS17 and CS23 (D) Trajectory of the tip of the right ribs (1st, 5th, 7th, 10th, and 12th pairs) x,y coordinates from all samples were plotted on the x,y plane. The points were indicated by color, according to the CS, as follows: Blue; CS17, Light blue; CS19, Yellow; CS21, Red; CS23 The gray line and dots indicate the average form of each pair of ribs obtained from samples between CS18 and CS23.
Figure 7. Left lateral drawings of the rib cage between CS17 and CS23. The rib cage was represented by the connection of 84 landmarks. The scale represents 2.0 mm. The black arrows indicate the largest depth of rib cage. The ribs in the upper region elongated to gather to the 7th ribs, while the ribs in the lower region separated caudally (blue arrows).
C. Formation of the rib cage (ventral view)
The connection of the 84 landmarks determined on 12 pairs of ribs and vertebrae revealed the average form of the rib cage at each stage between CS17 and CS23 (Figure 5). The rib cage changed its form during the observation period. The rib cage size increased in height, width, and depth ( Figure 6A). The depth of the cage was smaller than the width and height at CS17-19.
Differentiation between the upper and lower parts of the rib cage became prominent after CS20 and two notable features were observed – the shift of the position of the largest width of the rib cage and the formation of ribs in the upper part of the rib cage. These two features have also been detected in transverse sections, and this was made clear through the ventral view.
One prominent feature was the shift of the position of the largest width of the rib cage (Figure 6B). The largest width of the rib cage was at the upper part of the cage, and ran caudally to the lower rib cage during observation periods, namely at the level of the 5th pair of ribs at CS17 (2.81 ± 0.35 mm), the 6th pair of ribs at CS18 (3.79 ± 0.72 mm), the 7th pair of ribs at CS19 (4.21 ± 0.80 mm), the 8th pair of ribs at CS20-CS22 ribs (4.68 ± 0.43 mm, 5.56 ± 0.33 mm, and 6.74 ± 0.53 mm, respectively), and the 9th pair of ribs at CS23 (8.24 ± 0.96 mm). These changes were detected by the ventral view. In addition, morphometry demonstrated the width of each paired rib from the 1st to the 12th pair.
Another is the formation of the upper rib cage, which is associated with the formation of the sternum and joining between the sternum and the rib cage. The tips of each pair of ribs from the 1st to the 7th rib became close to each other at the median plane (xy-plane), resembling the closing of a zipper from the cranial end to the caudal end between CS21 and CS23. Such movement was clearly detected by ventral images (Figure 5).
Morphometry measuring the length between the tips of each pairs of ribs (Figure 6C) and the trajectory of the tips of the ribs (Figure 6D) supported this phenomenon for upper rib cage formation. Specifically, measuring the lengths between the tips of all paired ribs showed that the tips of the paired ribs were separated by approximately 2-4 mm between CS17 and CS19 (range, 2.02 mm – 4.14 mm) for all 12 pairs of ribs. The length between the tips of the paired-ribs decreased in the upper ribs, while increasing in the lower ribs during development (Figure 6C). Therefore, formation of the lower ribs was different when compared to the formation of the upper ribs. After CS20, the paired ribs became closed, reaching a distance of approximately 1.0 mm from the 1st pair of ribs to the 7th at CS23 (range, 0.53 mm – 1.16 mm). The sternum may form between the tips of the first pair of ribs to the 7th pair. The trajectory of the tips of the ribs revealed that the tip elongated latero-ventrally between CS17 and CS18, and medial-ventrally after CS19 in the upper part of ribs (Figure 6D). The direction changed to ventral after the inter-tip closed ventrally. The 1st pair of ribs changed direction at CS21, the 2nd to 6th pairs of ribs changed around CS22, and the 7th pair of ribs changed at CS23.
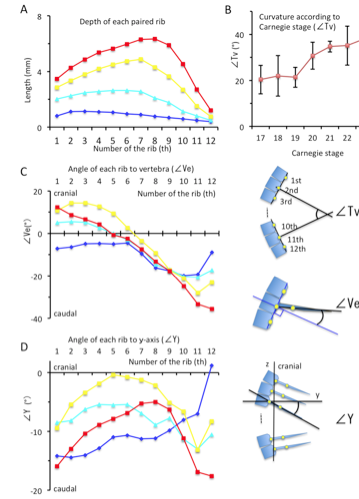
(A) Depth (in mm) of each paired rib by lateral view.
(B) Curvature of the rib cage (in degrees) according to Carnegie stage.
(C) The angle (in degrees) of each rib to vertebrae by lateral view.
(D) The angle of each rib in relation to the y-axis (ventral-dorsal axis).
Blue; CS17, Light blue; CS19, Yellow; CS21, Red; CS23
Illustrations indicating the ∠Tv, ∠Ve, and ∠Y provided on the right side.
D. Formation of the rib cage (Lateral view)
The depth of the rib cage was similar at the level of the 1st and 7th pairs of ribs (ranging from 1.68 mm – 2.81 mm) with the largest depth at the 3rd pair of ribs, during CS17 (Figure 7). Swelling of the rib cage was detected after CS20, with a prominent local maximum in the middle. The largest depth of the rib cage was at the level of the 7th pair of ribs at CS20 and CS21 (4.03 ± 0.42 mm and 4.87 ± 0.25 mm, respectively) and at the level of the 8th pair of ribs at CS22 and CS23 (5.30 ± 0.28 mm and 6.34 ± 0.96 mm, respectively)(Figure 8A).
The degree of curvature of the thoracic vertebrae was similar for CS17 through CS19; specifically, the measures of curvature were as follows: 20.3 ± 6.2 degrees at CS17, 22.0 ± 8.8 degrees at CS18, and 21.3 ± 4.3 degrees at CS19 (Figure 8B). The curvature was more prominent after CS20, 30.7 ± 5.9 degrees at CS20, increasing to 38.1 ± 6.6 degrees by CS23.
The angle of rib elongation from each vertebra was calculated by lateral view (Figure 8C). The ribs elongated caudally at CS17. The degree of rib elongation was lower in the lower region of the rib cage (range, -9.59 – -19.91 degrees) than in the upper region (range, -4.48 – -9.59 degrees). The direction of elongation changed during development; that is, the ribs elongated in the cranial direction in the upper region while elongating in the caudal direction in the lower region. The direction of elongation changed almost linearly, from 12.3 ± 14.3 degrees at the 1st rib to -35.6 ± 10.4 degrees at the 12th rib at CS23.
Since the curvature of the thoracic vertebrae affects the orientation of each rib forming the rib cage, the angle of each rib in relation to the y-axis (ventral-dorsal axis) was calculated (Figure 8D). During CS17, the angle increased from -14.2 degrees at the 1st rib to 1.2 degrees at 12th rib. The orientation changed during development. Even though all ribs elongated in the caudal direction, the local maximum was observed in the middle region of the rib cage. The local maximum was between the 4th pair of ribs at CS19 (-5.4 ± 5.3 degrees), between the 5th pair of ribs at CS21 (-0.4 ± 3.8 degrees), and between the 8th pair of ribs at CS23 (-5.0 ± 5.8 degrees). The data indicate that the ribs in the upper region elongate to gather towards the local maximum (around the 7th pair of ribs), while the ribs in the lower region separate caudally.
E. Shape of the ribs; Principle component analysis
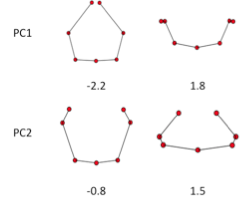
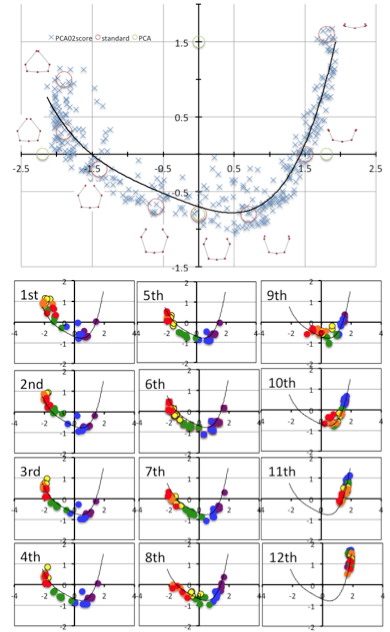
GPA and PCA was applied to all ribs except CS17. PC1and PC2 accounted for 76.3% and 16.4% (sum, 92.7%) of the total variance. PCA-3 account for 2.7%, which was smaller compared to the PC1 and PC2. That mean that the change of shape is accounted by two component. Change of PC1 and PC2 reflect the shape as shown in Figure 9. Change in PC1 shows the circular form surrounding the body trunk. Decrease of PC1 showed the closing of the tip of ribs, while increase of the PC1 showed the aperture of the tip of the ribs. Change in PC2 showed the dorsal convex of the ribs. Increase of PC2 showed the dorsal convex of the ribs while decrease of the PC2 showed the lateral projection at the middle part of the ribs.
Value of PC1 and PC2 by each rib was scatter plotted (Figure 10). The distribution showed the fishing needle like shape. Change in PC1 and PC2 were highly correlated. When the distribution was fit the equisition from quadratic to 7-order equation, R2 change to from 0.729 to 0.828. Increase of R2 was gentle between quartic equation and 7-order equation. Thus distribution was fitted to quartic equation as follows; y = 0.072×4 + 0.1535×3 + 0.1785×2 – 0.2976x – 0.7001; R² = 0.82.
The shape at which PC1 and PC2 value was plotted by the red circle was shown. The shape at which PC1 and PC2 value was plotted by the green circle was shown.
Fig.11 PC1 and PC2 plots by each ribs according to the development from CS 18 to CS 23.
PC1 and PC2 plots of each rib moved its position along to the fitting curve according to the development from CS 18 to CS 23 (Figure 11).The scattered plots moved by wide range from ceter-right (quadrant IV) to left, reached to the left end (quadrant II) of the fitting curve and slightly back in the upper ribs (1-7). While scattered plots moved by narrower range from the center-right to central parts ((quadrant IV)in the lower ribs. The movement was limited at right part (quadrant I) in 11th and 12th ribs.
F Shape and centroid size correlation
PC1 and PC2 Value of each rib was plotted closed to the fitting curve by which the shape may be determined by one parameter.
High Correlation between PC1 and PC2 imply that the change in PC1 and PC2 could be expressed by one parameter. We used the fitting curve as linear scale for Shape [Shape]. Namely, the right end of the fitting curve (2.0,1.8) was determined as origin O of [Shape] while the left end of the curve (-2.3, 1.0) was 6.6. PC1 and PC2 plot by rib x can determine the nearest points X on the fitting curve. The distance XO along the fitting curve was defined the value of rib x for [Shape].
[Shape]=0.15 showed that the paired ribs are dorsal side of the body trunk with aperture of the tip of the ribs (Figure 12). [Shape]=2 showed that the paired ribs surrounded dorsal side of the body trunk with dorsal convex of the ribs. The tip of the ribs were aparted. [Shape]=4 showed that the paired ribs are the circular form surrounded more than half of the body trunk with the lateral projection at the middle part of the ribs. [Shape]=6 showed that the paired ribs are the circular form surrounding almost all the body trunk with dorsal convex of the ribs The tip of bilateral ribs are almost closed.The relation between centroid size and the shape according to development was shown. The change in shape was prominent according to the CS in the upper ribs (1-7). It is noted that while change in centroid size was inconspicuous in the upper ribs (1-7) though the length of each rib elongate linearly. While the increase in size was prominent and change in shape was inconspicuous in the lower ribs (8-12).
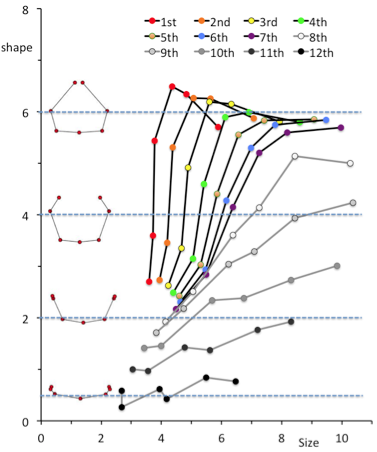
The line for each rib according to CS was changed gradually according to the change of from upper to lower ribs.
Discussion
PC1and PC2 accounted for 76.3% and 16.4% (sum, 92.7%) of the total variance, that mean that the change of shape is mainly documented by two component. Change in PC1 shows the circular form surrounding the body trunk. Decrease of PC1 showed the closing of the tip of ribs, while increase of the PC1 showed the aperture of the tip of the ribs. Change in PC2 showed the dorsal convex of the ribs. Increase of PC2 showed the dorsal convex of the ribs while decrease of the PC2 showed the lateral projection at the middle part of the ribs.
Distribution of PC1 and PC2 value by each rib showed high correlation with fitted to quartic equation (y = 0.072×4 + 0.1535×3 + 0.1785×2 – 0.2976x – 0.7001; R² = 0.820). PC1 and PC2 value of each rib pair moved its position along to the fitting curve according to the development from CS 18 to CS 23. The change in PC1 and PC2 could be expressed by one parameter using fitting curve as linear scale for Shape, indicating that all 12 paired ribs differentiate its shape according to a common sequential changes during human embryonic period.
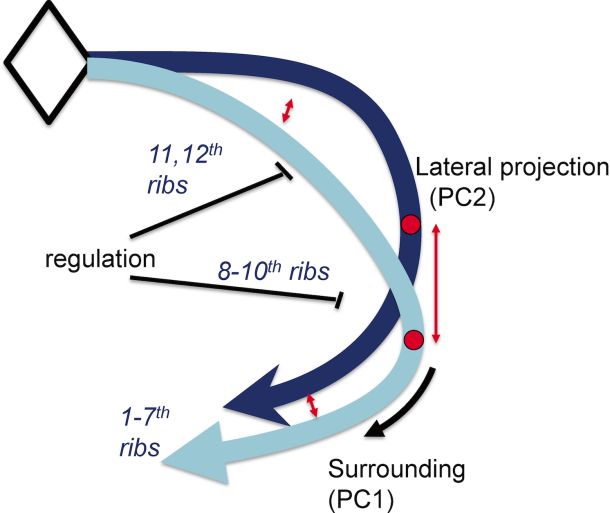
The data suggested, in a parsimonious model, that the common series of rib pairs can be controlled by a small number of factors (Figure 13). For example, the difference between true ribs, false ribs, and floating ribs observed in the rib cage could arise through the timing of when and where the common series of rib pair formation stopped differentiating.
Conclusion
The change in PC1 and PC2 could be expressed by one parameter using fitting curve as linear scale for Shape, indicating that all 12 paired ribs differentiate its shape according to a common sequential changes during human embryonic period.
Acknowledgment
We thank to Dr.Atsushi Saito and Prof. Akinobu Shimizu at Tokyo University of Agriculture and Technology for providing the Matlab software program for PCA. We thank to Dr. Shigehito Yamada and Dr. Koichi Ishizu for intense arguments. This work has been performed under the approval of the Photon Factory Program Advisory Committee (Proposal No.2013G514, 2012G138, 2014G018, 2015G574, 2016G171, and 2017G688).
.
References
- S. M. Metev and V. P. Veiko, Laser Assisted Microtechnology, 2nd ed., R. M. Osgood, Jr., Ed. Berlin, Germany: Springer-Verlag, 1998.
- Blaas HG. 2014. Detection of structural abnormalities in the first trimester using ultrasound. Best Pract Res Clin Obstet Gynaecol 28:341–353.
- Pooh RK, Shiota K, Kurjak A. 2011. Imaging of the human embryo with magnetic resonance imaging microscopy and high-resolution transvaginal 3-dimensional sonography: human embryology in the 21st century. Am J Obste Gynecol 20477:e1–16.
- O’Rahilly R, Müller F. 2001. The skeletal system and limbs. In: O’Rahilly R, Müller F, editors. Human Embryology & Teratology. 3rd ed. New York: Wiley-Liss. p 357-394.
- .Jellema LM, Latimer B, Walker A. 1993. The rib cage. In: The Nariokotome Homo Erectus Skeleton. Cambridge: Harvard University Press. pp. 294-325.
- LoMauro A, Pochintesta S, Romei M, D’Angelo MG, Pedotti A, et al. 2012. Rib Cage Deformities Alter Respiratory Muscle Action and Chest Wall Function in Patients with Severe Osteogenesis Imperfecta. PLOS ONE 7:e35965
- Bastir M, García Martínez D, Recheis W, Barash A, Coquerelle M, Rios L, et al. 2013. Differential growth and development of the upper and lower human thorax. PLoS One 8:e75128.
- Takakuwa T. 2018. 3D analysis of human embryos and fetuses using digitized datasets from the Kyoto Collection, Anat Rec 301:960-969
- .Nishimura H, Takano K, Tanimura T, Yasuda M. 1968. Normal and abnormal development of human embryos: first report of the analysis of 1,213 intact embryos. Teratology 1:281–290.
- Yasuda M. 2018. The Beginning of Kyoto Collection: Focus on Memories. Anat Rec. 301:951-954
- Yamaguchi Y, Yamada S. 2018. The Kyoto collection of human embryos and fetuses: history and recent advancements in modern methods. Review Article. Cells, Tissues and Organs 2018, in press
- Yoneyama A, Yamada S, Takeda T. 2011. Fine biomedical imaging using X-ray phase-sensitive technique. In: Gargiulo G, editor. Advanced biomedical engineering, Rijeka: InTech. p. 107–128.
- Yoneyama A, Takeda T, Tsuchiya Y, Wu J, Lwin TT, Koizumi A, Hyodo K, Itai Y. 2004. A Phase-Contrast X-Ray Imaging System – With a 60 × 30 Mm Field of View – Based on a Skew-Symmetric Two-Crystal X-Ray Interferometer. Nucl Instrum Methods A523:217-222.