Abstract-The three-dimensional (3D) observations are required for analyzing complex morphogenetic processes that occur during human embryonic development. Serial histological sections were utilized not only for histological two-dimensional observation, but also for designing three-dimensional (3D) plaster or wax models, which enable the 3D changes to be visible, since the late nineteenth century. Analysis using the histological sections is the main approach that is developed in the recent studies. Additionally, imaging modalities, such as magnetic resonance imaging and phase contrast X-ray computed tomography, have been applied to embryology. High-resolution 3D datasets with an adequately large number of samples, covering a broad range of developmental periods with various methods of acquisition, are key features for the research. These datasets have the advantage of morphology, morphometry, and quantitative analysis using 3D coordinates. In particular, an adequate sample size is required for quantitative analysis using statistical methods and multidisciplinary computational anatomy (MCA) based analysis, which are expected to be useful analyzing methods for many unresolved tasks, such as quantitative movement (differential growth), branching morphogenesis, and information concerning physical and structural property. As a future perspective, analysis targets using digital imaging data may shift from embryonic period to early-fetal period (9-12 weeks after fertilization), which can apply to prenatal diagnosis using ultrasound. This data will timely contribute to improvements in prenatal diagnostics by detailing and comparing suitable markers for estimating developmental growth.
Three-dimensional analysis of human development using histological sections
Research for human embryology has been initiated since the late nineteenth century [1,2]. The morphological observations of human embryonic samples were the main approaches, including observation of the gross view, dissection, and histological sectioning. Classical embryology using histological techniques previously revealed a large number of morphological features according to the developmental stages and significantly contributed to the understanding of human development. Complex morphogenetic processes occur during embryonic development, which demanded the three-dimensional (3D) observations expanding to large areas. The 3D analyses using histological sections become the main approaches, which enable the 3D changes to be visible. Serial histological sections were not only utilized for histological two-dimensional observation, but also applied to design 3D plaster or wax models. The work of a team of scientists and technical specialists, such as illustrators and modelers, was established for development of human embryology. The historical models of Ziegler, Blechshmidt, and Heard are famous worldwide and are indispensable in research and teaching [3].
The 3D analyses using histological sections advanced with the advent of new technology. These include acquisition systems for digitalization of the samples, higher specification computers, and higher volume of storage. The digitized materials are primarily used for education and assistance of research, as they are attractive materials for students and researchers who could be apprehensive. They are also useful for database and references for the researches [4,5]
Using nearly 15,000 digitalized histological sections of the renowned Carnegie Collection of human embryonic specimens, de Bakker et al (2016) [6] created a 3D digital atlas and database featuring the first 2 months of human development. They identified and labeled up to 150 organs and structures per specimen and made 3D models to quantify growth, establish changes in the position of organs, and clarify current ambiguities. The 3D portable document formats of the reconstructions, and original and labeled images, are freely available (http://3datlasofhumanembryology.com).
Using whole-mount immunostaining, 3D imaging of solvent-cleared organ clearing and light-sheet imaging, Belle et al (2017) [7] generated a precise cellular and molecular cartography, a 3D cellular map of the human embryonic development during the first trimester of gestation. They provided high-resolution 3D images of the developing peripheral nervous, muscular, vascular, cardiopulmonary, and urogenital systems. Their work paved the way for a cellular and molecular reference atlas of human cells. All their 3D datasets are made available on a dedicated website (https://transparent-human-embryo.com/).
For an administrator of human embryo collections, the digitization of the histological glass slides is one solution for preserving the collections and for decreasing the maintenance cost. The Digital Embryology Consortium, an international partnership, was established in 2014 to digitize, preserve, and disseminate the major embryology histological collections for researchers (https://embryology.med.unsw.edu.au/embryology/index.php/Digital_Embryology_Consortium_-_Information) [8].
3D analysis of human development using imaging modalities in high resolution
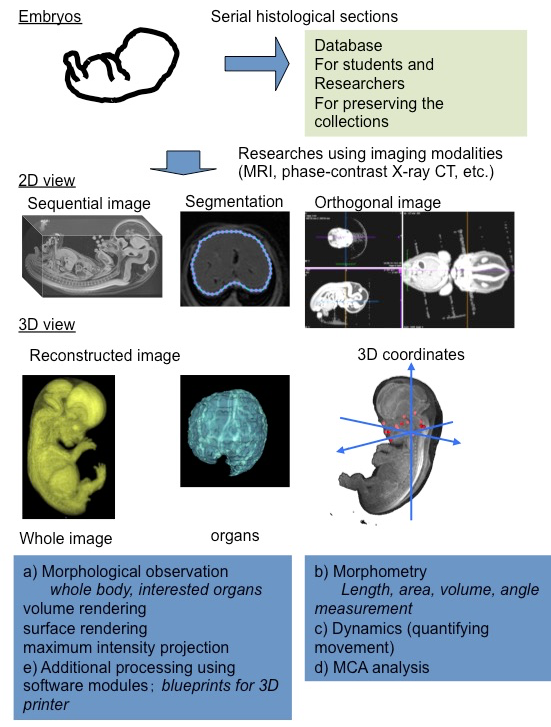
Figure 1. Three-dimensional analysis of human embryonic development, including organogenesis using digital datasets: outline.
Remarkable progress has been made in non-destructive imaging technologies, such as magnetic resonance imaging (MRI) and phase contrast X-ray computed tomography (CT), which have all been applied to embryology [9,10]. The imaging modalities are selected based on their destructive versus non-destructive features, the size of the samples, and the desired resolution.
Using MRI and ptychographic X-ray CT, our group proceeded the 3D analysis of human embryonic development, including organogenesis as research [11] (Figure 1). High-resolution 3D datasets with an adequately large number of samples, covering a broad range of developmental periods with various methods of acquisition, are key features for this research. These data sets have the advantage of morphology, morphometry, and quantitative analysis using 3D coordinates. In particular, an adequate sample size is required for quantitative analysis using statistical methods and PCA.
Morphological observations
The digital data had the following gross merits, which increased the efficiency of observations and accelerated the speed of morphological observations: 1) The data enabled us to analyze classical morphology and morphometry efficiently. 2) The complete 3D external and internal views and their reconstructions are easily obtained. 3) The obtained images can be resliced and rotated freely on the screen, by which the 3D shapes of the objects and their spatial relationships with the adjacent organs and tissues are easily recognizable. 4) The images from different embryos are simultaneously comparable on the screen. 5) Volume-rendering data can be utilized for advanced analysis.
Morphometry
Classical embryology using histological techniques provided little morphometric data [12,13]. For the measurement of spatial distances and angles between anatomical landmarks of interest, 3D reconstruction from serial histological sections was required. The procedure for such measurements was quite laborious with a number of possible issues that could arise, such as non-rigid deformation, tissue discontinuity, and accumulation of scale [A1] [14]. The digital data from MRI and CT have merit for morphometry. Precise morphometric data, length, angle, area, and volume of target regions and organs can be measured on the screen using digitalized data from MRI and CT images. Such morphometric data are useful for demonstrating the development features at each stage and for screening abnormally developed samples.
Quantitative analysis using 3D coordinates
A 3D coordinate can be given for each landmark by examining the position of the voxel on 3D digital data. Application of 3D coordinates of anatomical landmarks, especially MCA based analysis, are expected to be useful analyzing methods for many tasks, which remain to be dissolved as follows:
Quantitative movements (differential growth)
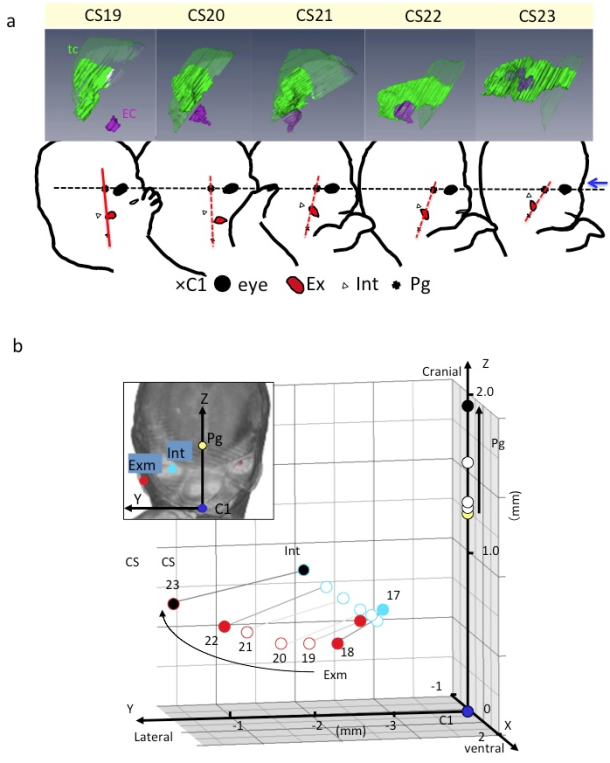
Figure 2. Three-dimensional analyses of quantitative movements (differential growth) A) Lateral view of embryos between Carnegie stage (CS) 19 and CS 23 showing the tympanic cavity and ear canal (upper) and craniofacial morphogenesis (lower). The ear canal (ec), external ear (Ex), eye (Ey), first cervical vertebra (C1), internal ear (int), pituitary gland (Pg), and tympanic cavity (tc). The dashed line indicates the reference axis connecting the middle point of the bilateral Ey and Pg (X-axis). The red line indicates the reference line connecting Pg and C1. Blue arrow indicates the frontal side of the face. Note that the Exm and Int are observed at similar position on the red segment. There is a gross change of angle between the black and red lines used. The change of angle may result from the formation of the mandibular apparatus and the structures at the base of the skull. B) Three-dimensional graph showing the relationship between the right external ear (Exm) and internal ear (Int) during development. Axes and anatomical landmarks are shown on frontal view of volume-rendering images. Abbreviations: Carnegie stage (CS), external ear (Exm), first cervical vertebra (C1). internal ear (int), pituitary gland (Pg)
Both the external and internal structures of embryos rapidly change in size and shape during the period of organogenesis. Many dynamic events are traditionally described as migration in which the position of structures changes from one region of the embryo to another. Gasser (2006) [15] recently demonstrated most of the positional changes of the developing structures, such as the sclerotome formation from the somite, the spinal ganglion formation from the neural crest, and the endocrine glands formation from the pharyngeal endoderm, which can be explained by differential growth.
For understanding the positional change of landmarks of interest and their relationships during development, the digitized data was advantageous for comparing structures of interest between different stages with identical magnification, superimposed on the same screen. The 3D positional change of interesting landmarks and their relationships during development were demonstrated [11,16-18], which indicated that many dynamic events can be explained by differential growth using 3D coordinates (Figure 2).
Shared mechanism for human organogenesis (Branching morphogenesis)
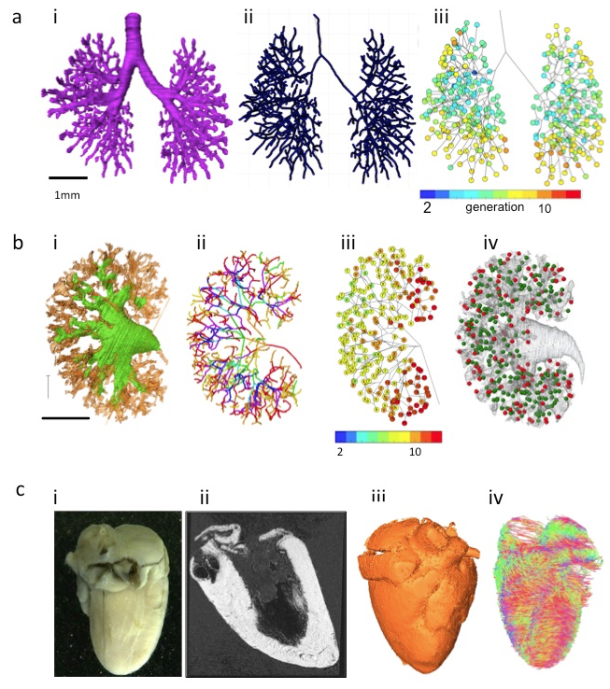
Organs, such as bronchi of the lungs, urinary collecting trees of the kidneys, the milk ducts of the mammary gland, develop from branched tubes during embryonic and fetal development. Because of many similarities between these branched tube structures, the shared mechanism was assumed. Recently, Hannezo et al (2017) [19] proposed a unifying theory to solve this issue. Namely, the certain tips stop growing in a random manner. For example, the branched mammary gland structures stop growing when the tips of the structure impinge on neighboring branches. In the kidney, this cessation has been proposed to occur when nephrons form near the end of the collecting ducts. The unifying theory mainly comes from experimental in vitro model or in vivo animal models. Analysis using human samples with 3D coordinates is awaited [20] (Figure 3AB).
Information concerning physical and structural property
Figure 3. Three-dimensional analysis using digitalized data acquired with imaging modalities A) Branching morphogenesis of the human bronchi during embryonic period (a) The bronchial tree was extracted from ptychographic X-ray computed tomography image. (b) Centerline of the bronchial tree was processed. (c) Generation number of each branch segments was indicated by colors. B) Branching morphogenesis of the human urinary collecting system (UCS) at Carnegie stage 23 (a) The UCS was extracted. (b) Centerline of the bronchial tree was processed. The tree was illustrated by rainbow colors from the proximal to peripheral branches. (c) Generation number of each branch segments was indicated by number and colors. (d) Position of nascent nephrons connected (green) and not connected (red) to UCS are shown. C) The fetal heart ex vivo (crown-rump length=94 mm) (a) The frontal gross view. (b) Magnetic resonance imaging (MRI)-T1 image. (c) The 3D volume-rendering image. (d) Diffusion tensor images MRI (DTI-MRI).
Imaging modalities data contain information not only regarding 3D morphology, but also regarding physical property. Diffusion tensor images MRI has also been applied to fetal brain [21] and cardiac muscles in mice [22,23]. The method is applicable to various organs and tissues that are anisotropic in nature (Figure 3C). Mesenchymal tissues consisting of fibers and membranous structures, such as the muscles, tendons, arteries, and bones, may be candidates for application of this method. These tissues have not been analyzed vigorously because of technical reason and their large target size.
Phase-contrast X-ray computed tomography with Zeff imaging methods can be used to recognize and differentiate heavy metals, such as iron, aluminum, nickel, and copper [24]. The 3D dynamics of such elements during human embryonic development are not currently known. Hematogenesis of the embryos may be also detectable using iron as a trace marker. This information with 3D distribution may provide new insight of human development.
Perspective
Shift from embryonic period to early-fetal period (9-12 weeks after fertilization)
The number of morphological studies on the early-fetal period (9-12 weeks after fertilization) is less as compared to that on the first 8 weeks after fertilization (at the end of Carnegie stage [CS] 23) [2] due to the several reasons. First, many researchers have been attracted to the dynamic morphogenesis in rather earlier developmental stages. Establishment of CS may contribute in encouraging studies for the early-fetal period. Second, it is difficult to apply histological analysis for the entire body of the fetus with a size larger than that at CS 23. Therefore, studies conducted on fetal period are mainly confined to localized histological analysis. The 3D datasets of larger samples corresponding to early-fetal period can be acquired with MRI in high resolution, which are worth analyzing as they can reveal the 3D development of the entire body and organs. Such morphometric data are also valuable for connecting and comparing the sonography data.
Application to prenatal diagnosis
The 3D information obtained in classical embryology since the late nineteenth century has been used as the basis of prenatal diagnosis using ultrasound (US). The use of US for prenatal diagnostics has rapidly increased in the past 30 years [25]. Moreover, 3D sonography performed with high-frequency transvaginal transducers has expanded as 3D sonoembryology, which provides a basis for assessing normal human development and can also be useful in detecting developmental anomalies [25,26].
Prenatal diagnosis using US enables a shift in diagnostics from the second trimester to the first trimester of gestation. At present, an embryo at 9 weeks after fertilization or younger can be assessed via morphological and morphometrical analyses, which corresponds to a CS of 15-16. While abnormal embryos younger than 12 weeks after fertilization are observed by chance for clinical indications, systematic screening using sonographic parameters results in the detection of abnormalities during the late first trimester (12-13 weeks after fertilization). Analysis using the digital data with MCA based method, during early-fetal period could timely contribute to improvements in prenatal diagnostics by detailing and comparing suitable markers for estimating growth and development [27].
References
Morgan LM. A social biography of Carnegie embryo no. 836. Anat Rec B New Anat. 2004; 276:3-7. doi: 10.1002/ar.b.20002.
O’Rahilly R, Muller F. Developmental stages in human embryos: including a revision of streeter’s horizons and a survey of the Carnegie collection. Washington: Carnegie Institution of Washington; 1987.
Smith BR. Visualizing human embryos. Sci Am. 1999; 280: 76-81. doi: 10.1038/scientificamerican0399-76.
Momose A, Takeda T, Itai Y, Hirano K. Phase-contrast X-ray computed tomography for observing biological soft tissues. Nat med. 1996; 2: 473-5. doi: 10.1038/nm0496-473.
Takakuwa T. 3D analysis of human embryos and fetuses using digitized datasets from the Kyoto Collection, Anat Rec. 2018; 301:960-9. doi: 10.1002/ar.23784
O’Rahilly R, Müller F. Developmental stages in human embryos: revised and new measurements. Cells Tissues Organs. 2010; 292:73-84. doi: 10.1159/000289817.
Levitan ML, Desmond ME. Expansion of the human embryonic brain during rapid growth: area analysis. Anat Rec. 2009; 292:472-80. doi: 10.1002/ar.20882.
Kajihara T, Funatomi T, Makishima H, Aoto T, Kubo H, Yamada S, et al. Non-rigid registration of serial section images by blending transforms for 3D reconstruction. Pattern Recognition. 2019; 96: 106956. doi.org/10.1016/j.patcog.2019.07.001
Gasser RT. Evidence that some events of mammalian embryogenesis can result from differential growth, making migration unnecessary. Anat Rec B New Anat. 2006; 289:53-63. doi: 10.1002/ar.b.20092.
Kagurasho M, Yamada S, Uwabe C, Kose K, Takakuwa T. Movement of the external ear in human embryo. Head Face Med. 2012; 8:2. doi: 10.1186/1746-160X-8-2.
Katsube, M, Yamada, S, Yamaguchi Y, Takakuwa T, Yamamoto A, Imai H, et al. Critical growth processes for the midfacial morphogenesis in the early prenatal period. Cleft Palate-Craniofacial J. 2019; 56: 1026–37. https://doi.org/10.1177/1055665619827189
Ozeki-Satoh M, Ishikawa A, Yamada S, Uwabe C, Takakuwa T. Morphogenesis of the middle ear ossicles and spatial relationships with the external and inner ears during the embryonic period. Anat Rec. 2016; 299: 1325-37. doi: 10.1002/ar.23457.
Hannezo E, Scheele CLGJ, Moad M, Drogo N, Heer R, Sampogna RV, et al. A unifying theory of branching morphogenesis. Cell. 2017;171: 242–55. doi: 10.1016/j.cell.2017.08.026.
Ishiyama H, Ishikawa A, Kitazawa H, Fujii S, Matsubayashi J, Yamada S, et al. Branching morphogenesis of the urinary collecting system in the human embryonic metanephros, PLoS ONE 2018; 13: e0203623. doi: 10.1371/journal.pone.0203623
Huang H, Xue R, Zhang J, Ren T, Richards LJ, Yarowsky P, et al. Anatomical characterization of human fetal brain development with diffusion tensor magnetic resonance imaging. J Neurosci 2009; 29:4263-73. doi: 10.1523/JNEUROSCI.2769-08.2009.
Mekkaoui C, Porayette P, Jackowski MP, Kostis WJ, Dai G, Sanders S, et al. Diffusion MRI tractography of the developing human fetal heart. PLoS One. 2013 ;8:e72795. doi: 10.1371/journal.pone.0072795.
Angeli S, Befera N, Peyrat JM, Calabrese E, Johnson GA, Constantinides CA. High-resolution cardiovascular magnetic resonance diffusion tensor map from ex-vivo C57BL/6 murine hearts. J Cardiovasc Magn Reson. 2014; 16:77. DOI: 10.1186/s12968-014-0077-x
Yoneyama A, Hyodo K, Takeda T. Feasibility test of Zeff imaging using x-ray interferometry. Appl Phys Lett. 2013; 103:204108. https://doi.org/10.1063/1.4831773.
Blaas HG. Detection of structural abnormalities in the first trimester using ultrasound. Best Pract Res Clin Obstet Gynaecol. 2014; 28:341–53. doi: 10.1016/j.bpobgyn.2013.11.004.
Pooh RK, Shiota K, Kurjak A. Imaging of the human embryo with magnetic resonance imaging microscopy and high-resolution transvaginal 3-dimensional sonography: human embryology in the 21st century. Am J Obste Gynecol. 2011; 204: 77:e1–e16. doi: 10.1016/j.ajog.2010.07.028.
Kobayashi A, Ishizu K, Yamada S, Uwabe C, Kose K, Takakuwa T. Morphometric human embryonic brain features according to developmental stage. Prenat Diagn. 2016; 36:338-45. doi: 10.1002/pd.4786.
Abstract. During human development, both external and internal morphological features change dramatically. External features, including those on the body and limbs, provide a good basis for determining the staging of each developing embryo. The application of three-dimensional (3-D) sonography with high-frequency transvaginal transducers has expanded and now fosters 3-D sonoembryology, which provides a basis for assessing normal human development and can also be useful in detecting developmental anomalies. The quantitative data of standard morphology for each Carnegie stage (CS) and early fetal period is required for the evaluation of the body and limbs in clinically obtained data, to allow for better prenatal morphological diagnosis. Analysis of the skeletal system during the human embryonic and early fetal period based will be described, including the rib cage, shoulder girdle, pelvis, and femur. The data obtained may contribute to such evaluations.
Introduction
During human development, both external and internal morphological features change dramatically. External features, including those on the body and limbs, provide a good basis for determining the staging of each developing embryo. For example, flexion and extension of the body combined with the posture of the upper and lower limbs have been integrated into the Carnegie stage (CS), which is universally accepted for determining the staging of human embryos [1]. Although such qualitative external changes are well described in the literature, 3-D quantitative changes in the body and limbs have not been well analyzed. The application of 3-D sonography with high-frequency transvaginal transducers has expanded and now fosters 3-D sonoembryology, which provides a basis for assessing normal human development and can also be useful in detecting developmental anomalies [2,3]. Such technology could contribute to more accurate prenatal diagnoses as well as enable a shift in the diagnostic time window (from the second to first trimester). Under these circumstances, the quantitative data of standard morphology for each CS and early fetal period are required for evaluation of the body and limbs in clinically obtained data, to allow for better prenatal morphological diagnoses. In the present chapter, analysis of the skeletal system during the human embryonic and early fetal period will be described, including the rib cage, shoulder girdle, pelvis, and femur.
Methods
All human embryo and early fetal specimens used are stored at the Congenital Anomaly Research Center of Kyoto University [4,5]. The phase contrast X-ray computed tomography (PXCT) and magnetic resonance imaging (MRI) were used for 3-D data acquisition [6,7]. PXCT and MRI data from selected embryos were analyzed precisely as serial 2-D and reconstructed 3-D images using Amira software (version 5.5; Visage Imaging, Berlin, Germany). The 3-D coordinates were initially assigned by examining the voxel position on 3-D images, which were subjected to principal component (PC) analysis and procrustes analysis.
Results
Rib cage
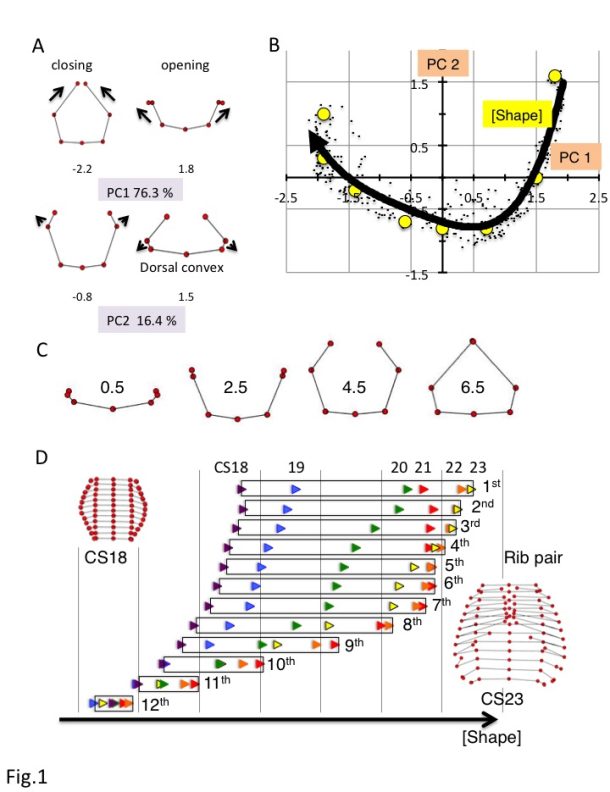
Fig. 14.1 Analysis of the rib cage based on MCA a) Changes in the ribs based on principal component analysis (PC) 1 and PC2. PC scores are indicated below each illustration. b) Scatter plot of PC1 and PC2 values for all rib pairs (n = 348). c) Rib morphologies for each F(Shape) value. d) Changes in F(Shape) according to rib number. CS18, purple; blue, CS19; green, CS20; red, CS21; orange, CS22; yellow, CS23.
The rib cage mainly consists of 12 pairs of ribs and vertebrae as well as the hypaxial muscles on the chest and upper abdominal parts of the body. In the early embryonic period until CS16, all visceral organs, such as the heart, lung, liver, and digestive tract, are covered with soft tissue. However, these organs are not protected by the rib cage because no cartilage or muscle formation is observed until CS16 [1,8]. Such organs are covered by the rib cage until the end of the embryonic period. The rib cage becomes detectable with cartilage formation at CS17, expanding outward from the dorsal side of the chest-abdominal region [9]. The ribs elongate progressively to surround the chest, differentiating into the upper and lower rib cage regions by CS20. The ends of the corresponding ribs in the upper region elongate towards each other, leading to their joining and sternum formation between CS21 and CS23, whereas the lower region of the rib cage remains widely open. The rib cage can be divided anatomically and functionally into the upper and lower thoracic regions. The upper region is related to the pulmonary part of the respiratory system and upper limbs, while the lower thorax is anatomically related to the diaphragmatic part of the respiratory system and also closer to the abdominal cavity and locomotor apparatus [10,11]. We aimed to analyze the morphogenesis of all ribs from the first to the twelfth rib pairs plus vertebrae to compare their differences and features according to the position along the cranial-caudal axis during the human embryonic period [12].
Seven rib cage landmarks, from the first to the twelfth vertebra, and the ribs (for a total of 84 landmarks) were located for each sample. A total of 384 sample data from 32 samples were subjected to process and principal component (PC) analyses, using MATLAB (R2017b, MathWorks, USA) software-assisted algorithms based on orthogonal coordinates of the voxels at each reference point. PC1 and PC2 accounted for 76.3% and 16.4% (sum, 92.7%) of the total variance, respectively, indicating that the change in shape was accounted for by two components (Fig.1A). Changes in PC1 resulted in a circular form surrounding the trunk. A decrease in PC1 showed closing of the rib tips, while an increase in PC1 showed opening of the rib tips. Changes in PC2 showed the movement of the lateral projection and dorsal convexity of the ribs. An increase in PC2 showed posterior movement of the lateral projection at the middle part of the rib, which is related to the dorsal convexity of the ribs, while a decrease in PC2 showed anterior movement of the lateral projection at the middle part of the ribs.
The distribution of scatter plots of the PC1 and PC2 values for each rib showed a fishhook-like shape (Fig.1B). The distribution was fitted to a quartic equation as follows: y = 0.072X4 + 0.1535X3 + 0.1785X2 – 0.2976X – 0.7001; R² = 0.82. PC1 and PC2 plots for each rib moved positions along the fitting curve according to the development of CS18 to CS23. The scatter plots moved in a wide range from the center right (quadrant IV) to the left, reached the left end (quadrant II) of the fitting curve, and moved slightly back in the upper ribs (1-7). However, the scatter plots moved in a narrower range from the center right to the center (quadrant IV) in the lower ribs. Movement was limited to the right (quadrant I) in the 11th and 12th ribs.
PC1 and PC2 values for each rib were plotted close to the fitting curve, for which the shape could be determined using a single parameter. We denote the fitting curve in the principal component subspace in Fig.1B by F(Shape), where Shape is the arc length parameter along the fitting curve and provides a linear scale for shape representation. Thus, the right end of the fitting curve (2.0,1.8) was designated as origin O of F(Shape), while the left end of the curve (-2.3, 1.0) was 6.6. PC1 and PC2 plots by rib x can determine the nearest point X on the fitting curve. The distance XO along the fitting curve was defined as the value of rib x for F(Shape).
F(Shape) = 0.5 showed that the paired ribs were on the dorsal side of the trunk with the opening of the rib tips (Figure 1C). F(Shape) = 2.5 showed that the paired ribs surrounded the dorsal side of the trunk with dorsal convexity of the ribs. The rib tips were separated. F(Shape) = 4.5 showed that the paired ribs had a circular form that surrounded more than half of the trunk, with the lateral projection at the middle part of the ribs. F(Shape) = 6.5 showed that the paired ribs had a circular form surrounding almost all of the trunk with the dorsal convexity of the ribs. The bilateral rib tips were almost closed. The change in F(Shape) at each rib pair is indicated. The development of each rib pair could be indicated as an increase in the F(Shape) scale in almost all conditions (Figure 1D). However, the development of a subset of rib pairs (1st-8th) resulted in a plateau or even decrease in the F(Shape) scale at the end of the embryonic period (between CS22 and CS23).
Our data clearly demonstrated that human embryonic ribs all progress through common morphological forms irrespective of their position on the axis. The data suggested that in a parsimonious model, the common series of rib pairs can be controlled by a small number of factors.
Femur
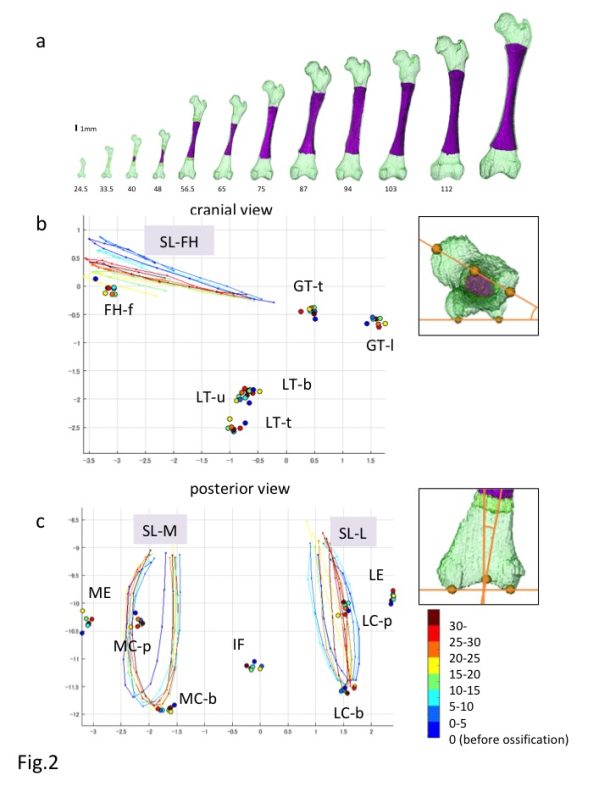
Fig. 14.2 Analysis of the femur based on MCA a) Reconstruction of the Femur during development b,c) Reconstructed Procrustes shape coordinates for the proximal (b) and distal (c) epiphysis of the fetal femur. FH-f: center of the femoral head fovea; GT-1: most lateral point of the greater trochanter; GT-t: top of the greater trochanter; IF: Intercondylar fossa; LC-b: lateral condyle (bottom); LC-p: lateral condyle (posterior); LE: lateral epicondyle; LT-b: bottom end of the lesser trochanter; LT-t: top of the lesser trochanter; LT-u: upper end of the lesser trochanter; MC-b: medial condyle (bottom); MC-p: medial condyle (posterior); ME: medial epicondyle; SL-FH: semi-landmarks from the upper end to the lower end of the femoral head along the plane passing through the midpoint of the femoral head, femoral neck, and greater trochanter; SL-L: semi-landmarks along the roundness of the lateral condyle from the upper end to the opposite side; SL-M; semi-landmarks along the roundness of the medial condyle from the upper end to the opposite side.
The femur is a long bone that develops via endochondral ossification. In particular, the human femur first appears as mesenchymal condensation between CS16 and CS17. Chondrification occurs between CS17 and CS18 and subsequently proceeds to endochondral ossification between CS22 and CS23 [1,8,13]. The cartilage structure influences bone structure formation, as the cartilage structure acts as the blueprint replaced by the bone structure. How the morphological features of the cartilage structure may be replaced by those of the bone structure has not been fully demonstrated, especially precise quantitative information regarding the 3-D formation of the femur.
The morphogenesis and internal differentiation process of the femur were analyzed in 3-D from the fetus (CRL11-185 mm, n = 62) [14]. Procrustes analysis was performed to distinguish the change in shape from the change in size according to growth using defined landmarks (n = 13) and semi-landmarks (n = 3). Centroid sizes at both the proximal and distal epiphyses showed a strong positive correlation with the ossified shaft length (OSL)(R2 = 0.99 and 0.99). The Procrustes shape coordinates for the proximal epiphysis indicated that each landmark on the greater and lesser trochanters and femoral head fovea was located in the same position irrespective of the OSL (Fig. 2A). In comparison, semi-landmarks at femoral head (SL-FH), which lined the femoral head, moved in accordance with the increase in OSL. Procrustes analysis indicated that changes in the femur shape after ossification were limited, and were mainly detected at the time of initial ossification and shortly thereafter. In contrast, femoral neck anteversion and torsion of the femoral head continuously changed during the fetal period. The Procrustes shape coordinates for the distal epiphysis indicated that each landmark was located in the same position irrespective of the OSL (Fig. 2B). semi-landmarks along the lateral and medial condyles (SL-L, SL-M) were located in different positions according to the OSL, although no obvious regularity was noted.
Torsion of the lower leg, including the femur (anteversion), was continuously observed during the fetal period and after birth [15-17]. Torsion of the femur may be affected by repetitive and persistent mechanical forces and the intrauterine position [3]. With respect to mechanical forces, muscle tension and local forces exert a rotary stress on the epiphysis. Remodeling at the metaphysis and epiphysis during the growth of a long bone such as the femur is well known as the mechanism that maintains the shape [8]. Anatomical landmarks remained in the same relative position during subsequent endochondral ossification in the present study, indicating that the remodeling system during femur shaft growth in the longitudinal direction is elaborate.
Shoulder girdle
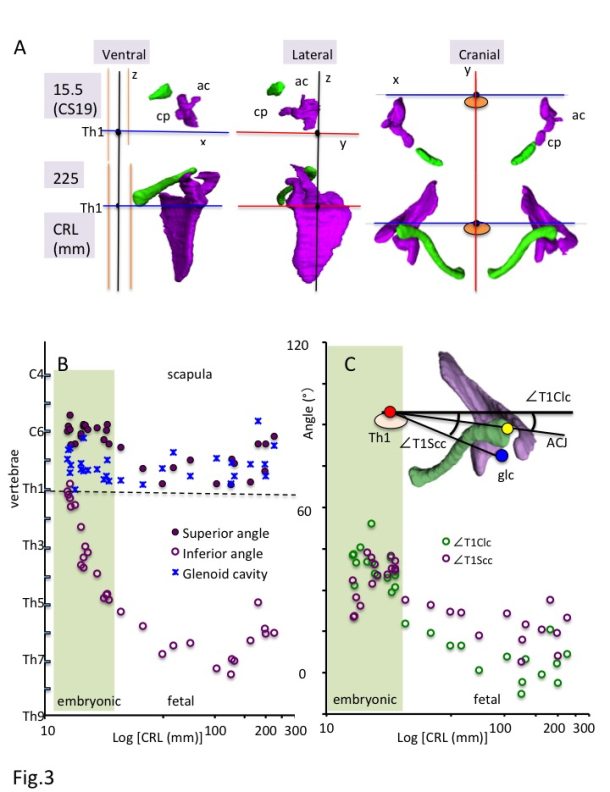
Fig. 14.3 Analysis of the shoulder girdle based on MCA a) Ventral, lateral, and cranial views of the 3-D reconstruction of the scapula (purple) and clavicle (green) in the embryonic (CS19) and fetal (CRL 225 mm) period. Th1: first thoracic vertebra; ac: acromion; cp: Coracoid process. b) Position of the scapula along z-axis. Solid purple circles indicate the superior angle of the scapula (spa), open purple circles indicate the inferior angle of the scapula (ifa), and blue stars indicate the center of the glenoid cavity (glc). c) Relationship between the scapula and clavicle from the cranial view. Solid yellow circles indicate the angles between the glc-Th1 and ACJ-Th1 segments from the cranial view (∠T1Scc-∠T1Clc).
The 3-D reconstruction and morphometry in our study revealed that all landmarks on the shoulder girdle remained at a similar height except the inferior angle, which means that the scapula enlarges in the caudal direction and reaches the adult position during the fetal period (Fig. 3A-B). The position of the shoulder girdle during the embryonic and fetal periods was unique (Fig. 3A and 3C). In contrast to the constant position of the clavicle, the scapula body was rotated internally and upward at the initiation of the morphogenesis. Thus, the scapula body of both seems almost parallel. The internal rotation of the scapula was changed externally, while the upward rotation remained unchanged. Compared with the adults, the scapula was still rotated internally and upward during the fetal period. The shoulder girdle is located in the ventral part of the body (vertebrae) during the initial morphogenesis, which changes the position to the lateral side of the vertebrae during the late embryonic period and fetal growth. The position during the fetal period may be consistent with that in adults. Such unique positioning of the shoulder girdle may contribute to the stage-specific posture of the upper limb, which is an important external feature for determining the staging, especially between CS18 and CS23 [1]. For example, the axial skeleton (vertebrae) becomes straight and the upper limb extends vertically to the axial skeleton at CS19. The shoulder (humerus head) becomes externally evident, and the joint flexed with the elbow is pronated at CS23. The posture may be explained, in part, by the unique positional change of the scapula during the embryonic period.
Conclusion
Skeletal system analysis may provide a useful standard for morphogenesis and morphometry of the skeletal system, which can serve as the basis to better understand embryonic and early fetal development and aid in differentiating normal and abnormal development.
References
O’Rahilly R, Muller F. Developmental stages in human embryos: including a revision of Streeter’s horizons and a survey of the Carnegie collection. Washington: Carnegie Institution of Washington; 1987.
Blaas HG. Detection of structural abnormalities in the first trimester using ultrasound. Best Pract Res Clin Obstet Gynaecol. 2014; 28:341–53. doi: 10.1016/j.bpobgyn.2013.11.004.
Pooh RK, Shiota K, Kurjak A. Imaging of the human embryo with magnetic resonance imaging microscopy and high-resolution transvaginal 3-dimensional sonography: human embryology in the 21st century. Am J Obste Gynecol. 2011; 204: 77:e1–e16. doi: 10.1016/j.ajog.2010.07.028.
Nishimura H, Takano K, Tanimura T, Yasuda M. Normal and abnormal development of human embryos: first report of the analysis of 1,213 intact embryos. Teratology. 1968; 1:281–90.
Yamaguchi Y, Yamada S. The Kyoto collection of human embryos and fetuses: history and recent advancements in modern methods. Cells Tissues Organs. 2018; 205:314–9. doi: 10.1159/000490672.
Yoneyama A, Yamada S, Takeda T. Fine biomedical imaging using X-ray phase-sensitive technique. In: Gargiulo G, editors. Advanced Biomedical Engineering. Rijeka: InTech; 2011. p 107–128.
Toyoda S, Shiraki N, Yamada S, Uwabe C, Imai H, Matsuda T, et al. Morphogenesis of the inner ear at different stages of normal human development. Anat Rec. 2015; 298:2081–90. doi: 10.1002/ar.23268.
O’Rahilly R, Müller F. The skeletal system and limbs. In: O’Rahilly R, Müller F, editors. Human Embryology & Teratology. 3rd ed. New York: Wiley-Liss; 2001. p 357–94.
Okuno K, Ishizu K, Matsubayashi J, Fujii S, Sakamoto R, Ishikawa A, et al. Rib cage morphogenesis in the human embryo: A detailed three-dimensional analysis. Anat Rec. 2019; 302: 2211-23, doi: 10.1002/ar.24226.
Bastir M, García-Martínez D, Recheis W, Barash A, Coquerelle M, Rios L, et al. Differential growth and development of the upper and lower human thorax. PLoS One. 2013; 8:e75128. doi: 10.1371/journal.pone.0075128.
García-Martínez D, Recheis W, Bastir M. Ontogeny of 3D rib curvature and its importance for the understanding of human thorax development. Am J Phys Anthropol. 2016; 159:423–31. doi: 10.1002/ajpa.22893.
Matsubayashi J, Okuno K, Fuji S, Ishizu K, Yamada S, Yoneyama A, et al. Human embryonic ribs all progress through common morphological forms irrespective of their position on the axis, Dev Dyn. 2019, 248, 1257-63, doi: 10.1002/dvdy.107.
O’Rahilly R, Gardner E. The timing and sequence of events in the development of the limbs in the human embryo. Anat Embryol. 1975;148: 1-23. doi: 10.1007/BF00315559.
Suzuki Y, Matsubayashi J, Ji X, Yamada S, Yoneyama A, Imai H, et al. Morphogenesis of the femur at different stages of normal human development, PLoS ONE. 2019;14: e0221569. doi: 10.1371/journal.pone.0221569.
Felts WJ. The prenatal development of the human femur. Am J Anat. 1954;94: 1-44. doi: 10.1002/aja.1000940102.
Guidera KJ, Ganey TM, Keneally CR, Ogden JA. The embryology of lower-extremity torsion. Clin Orthop Relat Res. 1994;302: 17-21.
44. Fujii S, Muranaka T, Matsubayash J, Yamada S, Yoneyama A, Takakuwa T. The bronchial tree of the human embryo: an analysis of variations in the bronchial segments. J Anatomy 2020, 237, 311-322. doi: 10.1111/joa.13199.
Abstract
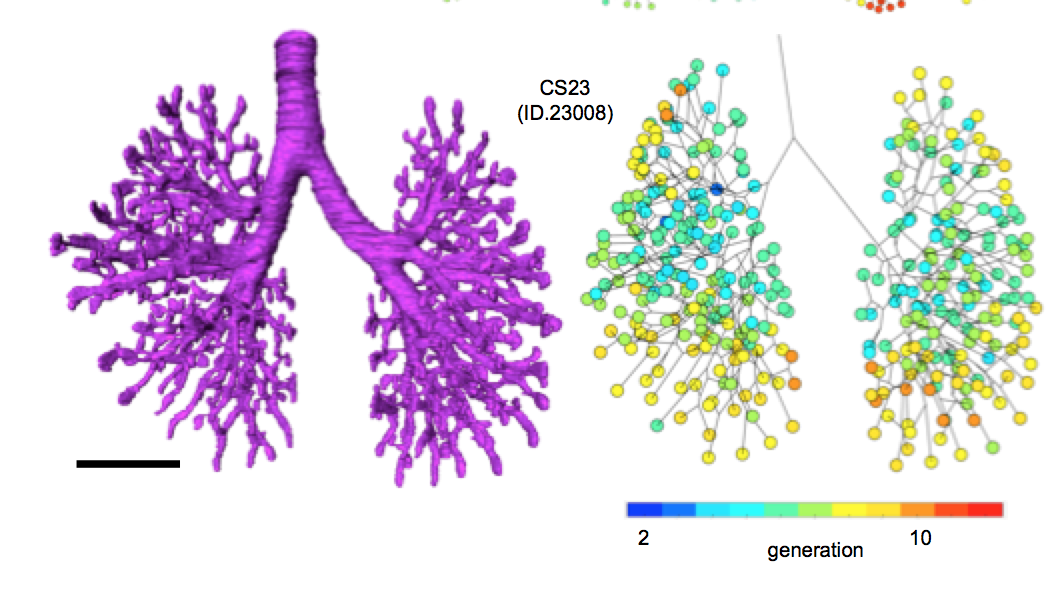
A classical study has revealed the general growth of the bronchial tree and its variations up to Carnegie stage (CS) 19. In the present study, we extended the morphological analysis CS by CS until the end of the embryonic period (CS23). A total of 48 samples between CS15 and CS23 belonging to the Kyoto Collection were used to acquire imaging data by performing phase-contrast X-ray computed tomography. Three-dimensionally reconstructed bronchial trees revealed the timeline of morphogenesis during the embryonic period. Structures of the trachea and lobar bronchus showed no individual difference during the analyzed stages. The right superior lobar bronchus was formed after the generation of both the right middle lobar bronchus and the left superior lobar bronchus. The speed of formation of the segmental bronchi, sub-segmental bronchi, and further generation seemed to vary among individual samples. The distribution of the end-branch generation among five lobes was significantly different. The median branching generation value in the right middle lobe was significantly low compared with that of the other four lobes, whereas that of the right inferior lobe was significantly larger than that of both the right and left superior lobes. Variations found between CS20 and CS23 were all described in the human adult lung, indicating that variation in the bronchial tree may well arise during the embryonic period and continue throughout life. The data provided may contribute to a better understanding of bronchial tree formation during the human embryonic period.
Fujii S, Muranaka T, Matsubayash J, Yamada S, Yoneyama A, Takakuwa T. The bronchial tree of the human embryo: an analysis of variations in the bronchial segments. J Anatomy 2020, 237, 311-322. doi: 10.1111/joa.13199.
Matsubayashi J, Okuno K, Fuji S, Ishizu K, Yamada S, Yoneyama A, Takakuwa T. Human embryonic ribs all progress through common morphological forms irrespective of their position on the axis, Dev Dyn 2019, 248, 1257-1263, doi: 10.1002/dvdy.107
Okuno K, Ishizu K, Matsubayashi J, Fujii S, Sakamoto R, Ishikawa A, Yamada S, Yoneyama A, Takakuwa T. Rib cage morphogenesis in the human embryo: A detailed three-dimensional analysis. Anat Rec 2019, 302, 2211-2223, doi: 10.1002/ar.24226
Ishiyama H, Ishikawa A, Kitazawa H, Fujii S, Matsubayashi J, Yamada S, Takakuwa T, Branching morphogenesis of the urinary collecting system in the human embryonic metanephros, PLoS ONE 13(9): e0203623. doi: 10.1371/journal.pone.0203623