


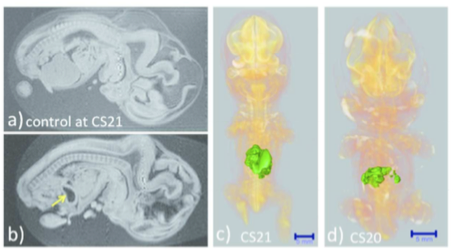
The liver was not observed; the stomach occupied the majority of the abdominal cavity (arrow).
Ventral view of the PCT 3D reconstructed images with liver malformation. (c) Sample at CS21. The liver volume was 2.2 SD below the mean for the stage of development. (d) Sample at CS20. The liver volume was 3.6 SD below the mean for the stage of development. The MRI (2.35 T) images from 1,156 embryos between CS14 and CS23 were screened using the volume of the liver (Kanahahi et al., 2016). Embryos with liver malformation were detected in the groups with liver volumes < 2.0 SD below the mean for the stage of development.
3.1 Merits of 3D datasets as digitized subjects
The digital data, in general, have gross merits. The digital data obtained are stable and can be easily duplicated, sent to suitable analysis systems, sent to co-workers, and transformed to other formats based on the purpose, such as for applying to specialized software on computer system, blueprint of 3D printing, construction of database and presentation on web via internet. Such merits enabled us to develop various analysis.
3.2 Representative methods for analysis
3.2.1) Morphological observations
From digitized datasets, the complete 3D external and internal views are easily obtained (Video 1). With segmentation of the anatomical structure of interest, the 3D reconstructed image for the structure was obtained. The 3D reconstructed images have many advantages. First, the obtained images are suitable for precise morphological observation because the images can be rotated freely on the screen, the 3D shapes of the objects and their spatial relationships with the adjacent organs and tissues are easily recognizable, and the images from different embryos are simultaneously comparable on the screen. Regarding the data from MRI and PCT, the distortion that occurs when 2D histological sections are compiled to form 3D reconstructions was avoided. The feature increased the efficiency of observations and accelerated the speed of morphological observations. For 2D observation, the data can be resliced freely by which we can observe any suitable planes.
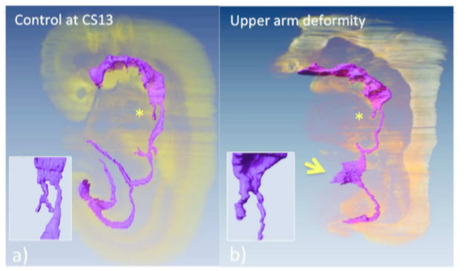
We created a precise timeline of events for the development and differentiation of the digestive tract and derived primordia between CS11 and CS13 (Ueno et al., 2016).
(a) Embryo in which the events of differentiation matched the timeline.
(b) The embryo had external abnormality with upper limb deformities (ID 15317). Embryo exhibited the following abnormalities in the digestive tract and derived primordia: the trachea was present, but the bifurcation was not formed (* and inserted figure), and the yolk sac was wide open at the length of three somite (indicated by arrow).
3.2.2) Morphometry
Classical embryology using histological techniques previously revealed a large number of morphological features according to the developmental stages and significantly contributed to the understanding of human development; however, these techniques provided relatively little morphometric data (O’Rahilly and Müller, 2010; Desmond and O’Rahilly, 1981; Levitan and Desmond, 2009). In classical embryology, morphometric studies in both 2D and 3D were previously analyzed using serial histological sections and visualized with 3D modeling and illustrations. These methods are laborious and inaccurate. In addition, few used samples were
evaluated based on the CS system (Desmond and O’Rahilly, 1981; Levitan and Desmond, 2009). In contrast, digital datasets can easily provide a suitable plane for morphometric analysis from staged human embryos. Precise quantitative data, length, angle, area, and volume of target regions and organs can be measured on the screen. Such morphometric data are useful for demonstrating the development features at each stage as well as for screening abnormally developed samples. We can select abnormal samples adequately in the liver and digestive tract (Kanahashi et al., 2016; Ueno et al., 2016) (Figures 2, 3; Videos 2, 3). Such 3D analysis may be applied to autopsy imaging for intrauterine fetal death and/or spontaneous abortion.
Morphometric data, according to human embryonic stages, are also valuable for connecting and comparing sonographic data, which is known as “sonoembryology” (Blaas, 2014). The digital data in our studies could contribute to improvements in prenatal diagnostics by detailing and comparing suitable markers for estimating developmental growth during earlier embryonic stages (Kobayashi et al., 2016).
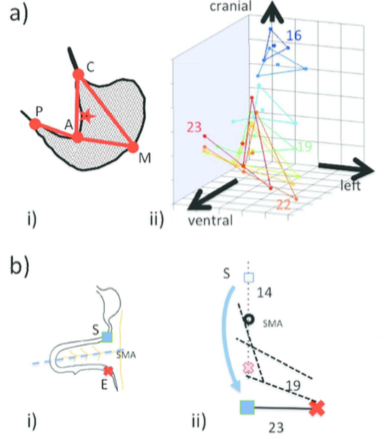
a-i) Anatomical landmarks are designated on the illustration of the maximum longitudinal plane of the stomach. C, cardia; P, pyloric antrum; A, angular incisura, M; local maximum on the greater curvature.
a-ii) 3D positional change of the stomach. C and P move almost near the midsagittal plane. The positional change of the stomach is restricted at both the entrance (C) and the exit (P), which are gradually stabilized after CS20. The stomach deflection is shown by the positional change of M. As a result, the stomach appears to rotate clockwise around the dorso-ventral axis and to move to the left laterally and caudally (Kaigai et al., 2014).
b-i) Illustrations of the anatomical landmarks.
b-ii) The rotation (viewed ventrally) of the start (S) and end (E) of the intestinal loop (IL) and their positions in relation to the proximal part of the superior mesentery artery (SMA) from CS14 to CS23 (end of physiological umbilical hernia stage). The IL rotated around the SMA only during earlier stages and gradually moved away, running transversely after CS19. The positional changes of the IL may be explained as the result of differential growth, suggesting that IL rotation is passive (Ueda et al., 2016).
3.2.3) Dynamics, quantifying positional change with 3D coordinates
A 3D coordinate can be given for each landmark by examining the position of the voxel on 3D digital data. The 3D coordinates of anatomical landmarks may be useful analyzing methods for understanding the positional change of landmarks of interest and their relationships during development. The digitized data was advantageous for comparing structures of interest between different stages with identical magnification, superimposed on the same screen.
Both the external and internal structures of embryos rapidly change in size and shape during the organogenic period. The many dynamic events are traditionally described as migration in which the position of structures changes from one region of the embryo to another. Gasser (2006) recently demonstrated most of the positional changes of the developing structures, such as sclerotome formation from the somite, spinal ganglion formation from the neural crest, and endocrine glands formation from the pharyngeal endoderm can be explained by differential growth. We demonstrated 3D positional change of the external ear, stomach, and rotation of intestinal loop via differential growth using 3D coordinates of the anatomical landmarks (Kagurasho et al., 2012, Kaigai et al., 2014, Ueda et al., 2016) (Figure 4, Video 4).
3.2.4) Mathematical analysis
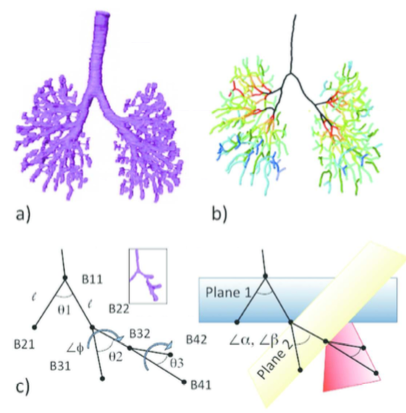
The 3D coordinates of anatomical landmarks can be applied in mathematical analysis. In particular, the branching pattern of the bronchial tree and the positional change of the ocular organs were analyzed with mathematical analysis (Takakuwa et al., 2016a; Shimizu et al., 2016) (Figure 5, Video 5).
3.2.5) Additional processing using software modules
Nowadays, there are many software modules that process the 3D data much more effectively, comprehensively, and attractively. Those modules were applied for the 3D analysis of human embryos (Figure 6, Video 6).
Recently, 3D printers, which are tools for making 3D solid objects from digital data, have become cheaper and more widespread. Digital data of human embryos can easily be utilized as blueprints for 3D printers after transforming the data format to .stl.
The printed 3D models allowed us to directly visualize the 3D appearance and to use tactile examination techniques (Shiraishi et al., 2013b) (Figure 6d). The use of 3D printed models is expected to compensate for the faults and limitations of computational graphics reconstructed on a 2D display. The models are also expected to act as attractive and intelligible tools for teaching.